Innovative engineering combines venturi and nuclear fraction metering.
Daniel Hompoth and Nathan Kuhn, Suncor Energy; Bruno G. Pinguet and Elsie Guerra, Schlumberger
Flowrate metering of heavy oil production from Steam-Assisted Gravity Drainage (SAGD) wells has long been conducted with equipment, e.g., test separators, not actually designed for surface conditions that reflect temperatures above 390°F (200°C). Nor are they designed for a fourth phase (steam), or for emulsions made difficult to predict by changing properties formed by water in equilibrium with steam and highly viscous oil.
Operators need accurate SAGD flowrate measurements to satisfy a number of crucial requirements, including the optimum well spacing, well length, steam injection, lift efficiency, and meeting rules for reporting to regulatory agencies. These accurate flow measurements also are necessary for validating the reservoir model and its predictions and optimizing the production from steam injection to gas lift injection or downhole pump settings.
Multiphase FlowMeters (MFM) provide better accuracy, much improved understanding of flow dynamics in real time, and demonstrate the ability to conduct more frequent well tests compared to data from conventional test separators. But positioning an MFM to handle the various monitoring scenarios unique to thermal production operations has created extreme challenges and, therefore, has not been done in Western Canada’s oil sands/heavy oil provinces.
“NORMAL” SAGD OPERATIONS
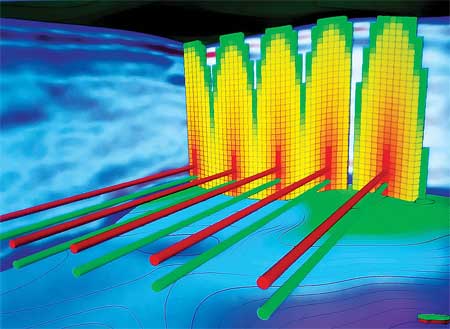
For SAGD well operation, high-pressure steam is directed via a horizontally drilled injection well into the pay zone at a high initial rate, Fig. 1. This creates a warmed, pressurized “steam chamber” that pushes the produced fluid by “natural lift” into a second horizontal production well drilled immediately below the injector. The injection-created steam chamber expands and, with continued extraction of the bitumen/water production stream via the producing well, injection pressure slowly declines. Eventually, this decline will call for the use of an artificial lift method, e.g., gas lift, or mechanical lift, such as Electrical Submersible Pump (ESP) or Progressive Cavity Pump (PCP), to drive the fluid to the surface. For duty in most SAGD producing wells, ESPs and PCPs, along with other downhole equipment, must withstand the high temperatures from steam injection.
 |
|
Fig. 1. Schematic of a SAGD well.
|
|
Additionally, ESPs and PCPs used for thermal production must be monitored daily and the data combined with fluid sample analyses to optimize pump operation. The reliability and accuracy of these data determines pump efficiency.
SUCCESSFUL APPLICATION
To determine the accuracy and reliability of flow-testing equipment for thermal heavy oil production, Suncor Energy, an operator of extensive SAGD production in northern Alberta, requested the use of a venturi and nuclear fraction MFM combination. This MFM has a flow-model and fluid-property package designed to address the conversion of the produced emulsion’s fluid properties from line to Standard Conditions (SC), and can withstand high wellstream temperatures during SAGD production. The test marked the first successful application of multiphase flowmetering in Canadian thermal recovery operations.
The well chosen for the field test (Well- P2P2) has a 1,608-ft (490-m) TVD and is completed with 3,281 ft (1,000 m) of slotted horizontal liner and an ESP. The well was chosen for its dynamic conditions and production history factors such as flowrate, line pressure, line temperature and fluid properties. Moreover, the well also had an existing surface bypass connection that allowed the connection of the MFM in series with an existing test separator.
The test had multiple objectives:
- To measure the well’s oil, water, steam and gas flowrates
- To understand the well’s SAGD dynamics
- To propose changes in ESP frequency to experience different production conditions, including line pressure, flowrates, phase fractions and ratios, i.e., Water/Liquid Ratio (WLR)
- To study the MFM’s sensitivity and performance against a valid reference by defining the results for stability, dynamic response, repeatability and reproducibility.
The conventional test equipment used for the comparison was a 4-ft (1.2-m) ID × 15-ft (4.6-m) T/T vertical separator. The reference used was a Coriolis meter located at the test separator liquid outlet. Liquid mass flowrate and liquid density and mass WLR, measured by the Coriolis, were compared to the same MFM measurements. While the test separator was equipped with pressure, temperature, level measurements and controls, it was not fitted to measure the gas rate or inline volumetric watercut. Among specific metrological concepts to be addressed were stability, dynamic response, repeatability and reproducibility.
With the well’s production shut in, the MFM was tied into existing connections on the tubing production flowline. After production was resumed, the produced fluids were redirected from the nearby group separator to the well’s test separator. To start the test, bypass valves were opened and the mainline valve closed to divert well production through the MFM, with simultaneous readings taken from both the MFM and the test separator at a distance of 66 ft (20 m).
Once underway, the test included data acquisition for the stable flow periods as well as the transition times between them. This operation was completed by changing ESP frequency and by bypassing the test separator. At test’s end, the production was aligned to the group separator. The different flow test periods are summarized in Table 1.
| TABLE 1. Summary of test flow periods |
 |
|
DENSITY, VISCOSITY ANALYSIS
To prepare the fluid-property package to produce flowrate measurements, technicians drew bitumen samples before testing began, which were delivered to a laboratory for analysis to determine bitumen density, water density and viscosity at differing temperatures and watercuts. The temperatures selected in the laboratory were based on the well’s production history. Readings chosen for analysis ranged from the minimum watercut from a bitumen sample to the maximum watercut in the stable emulsion.
To determine the watercut, the emulsion sample first was cooled to obtain gravity separation of most of the water content. More water was then removed by decanting. This helped determine the water density. The remaining bitumen was heated and centrifuged for three days to achieve the maximum watercut content possible (4.8%). The inversion point between bitumen and water continuous phase was between 55% and 65% when the water ceased to mix with the bitumen, creating a stable emulsion. The results achieved from the bitumen analysis are displayed in Table 2.
| TABLE 2. Bitumen density and viscosity at different temperatures and watercuts |
 |
|
BASIC PRINCIPLES OF THE MFM
The MFM is designed to measure the total volumetric flowrates of oil, water and gas from a producing well at line conditions, Fig. 2. These flowrates are converted to SC with a Pressure-Volume-Temperature (PVT) package contained in the metering software. The multiphase flow measurements are made using Schlumberger’s Vx technology, which allows measurement of oil, gas and water flowrates without the need for prior separation.
 |
|
Fig. 2. Schematic view of multiphase flowmeter.
|
|
Two basic measurements are made in the measurement section of the MFM:
- A venturi section gives the total mass flowrate and the total volumetric flowrate.
- A nuclear gamma-ray detector provides the hold-up of each phase in real time and then calculates the mixture density and WLR.
The densities of each phase are computed via the PVT package and transmitter measurements. The primary outputs of the MFM’s nuclear and venturi measurements are the total mass flowrate, the WLR and the Gas Volume Fraction (GVF). However, for this specific SAGD test, GVF could not be used for comparison with other devices. The secondary outputs from the meter are the volumetric flowrates (oil, water and gas) at line conditions. These calculations are based only on the combination of the previous primary outputs. Finally, the volumetric flowrates at SC are converted from the flowrates at line conditions, using the fluid property package.
Usually, MFMs are operated at pressures and temperatures well above those of separators, which is one of the advantages of such meters. A full and clear understanding of the fluid properties, error tolerance and MFM performance factors are necessary to ensure that the MFM is “fit for purpose.” Under these circumstances, the usual fluid property models developed for separators reach their limits.
Note that the overall metrological performance of the MFM depends on the accuracy of the required fluid property input parameters. The complete statement of a measured value should include an estimate of the level of confidence associated with the value. Properly reporting an experimental result along with its uncertainty allows accurate judgments about the quality of the experiments and facilitates meaningful comparisons with similar values.
TEST-MFM VS. CORIOLIS
Test results showed that the multiple objectives were reached.
Stability. The liquid mass flowrate results of the test during stable flow periods are depicted in Figs. 3, 4 and 5. The plots represent the mean and normal distribution obtained for each flow period, for each meter: the MFM and Coriolis. In all flow periods, the Standard Deviation (SD) and uncertainty of the MFM is better than those of the Coriolis, even though the mean is quite similar. Both meters have performed well under the same flow conditions, demonstrating that the Coriolis is working well within its operating envelope under stabilized flow and that the MFM is a robust meter. The quality of the measurements from both meters is outstanding within their respective working envelopes.
 |
|
Fig. 3. Mean and normal distribution of liquid mass flowrate, flow period 2: a) MFM, b) Coriolis at test separator.
|
|
 |
|
Fig. 4. Mean and normal distribution of liquid mass flowrate, flow period 3: a) MFM, b) Coriolis at test separator.
|
|
 |
|
Fig. 5. Mean and normal distribution of liquid mass flowrate, flow period 4: a) MFM, b) Coriolis at test separator.
|
|
Dynamic response. During the transition between flow periods, the dynamic response of the MFM excelled compared to the test separator. The MFM flowrates demonstrated a stable behavior from the moment pressure changes were induced; however, Coriolis flowrates reflected an erratic behavior dependent on the test separator settings and stabilization of the flow beyond 20 min.
Repeatability. To study repeatability of the MFM, the early stage of a stable flow period was compared to the late stage of the same stable flow period. The repeatability obtained from the test was exceptional, with a perfect matching of both results in terms of mean, SD and uncertainty.
Reproducibility. To study the reproducibility of the MFM, the results of two different stable flow periods were compared. The first flow period was done with an ESP frequency of 42 Hz, although this was subsequently changed. Later, 42 Hz was again set during flow period 4, and flowrates then were compared to those acquired in flow period 1. The MFM’s sampling rate was 45 Hz; the time between measurements was 22 ms. About 325,000 data points were recorded over the two-hour period. Reproducibility studies are more challenging for various reasons, e.g., reproduction of the same production conditions, performance of the flowmeter, etc. In SAGD production, however, field experience has shown that the early stage of a flow period under the same ESP frequency leads to similar results in terms of flowrate metering. The results obtained were outstanding.
CONCLUSIONS
Field tests demonstrated the performance of a venturi and nuclear fraction meter combination against a widely used reference meter installed on the liquid outlet of a test separator. The MFM has measured oil, water, gas, steam and WLR correctly in production environments typical for SAGD wells completed with mechanical artificial lift equipment such as ESP.
The high sampling rate of the technology aided in describing the dynamics of the flow by showing faster results during the transition periods, and by better describing the instantaneous phase fractions coming from the well. The MFM remained repeatable and reproducible during the entire test period. This may enable proper optimization of the well in a timely manner through modification of either the steam flowrate injection profile or the pump frequency. 
ACKNOWLEDGEMENT
This article was prepared from WHOC 2008-422 presented at the World Heavy Oil Congress in Edmonton, Alberta, March 10-12, 2008. The authors thank Suncor Energy and Schlumberger management for allowing them to publish the findings.
|
THE AUTHORS
|
| |
Daniel Hompoth is the Well Production Manager for Suncor’s Firebag SAGD project. His production operations experience includes cyclic steamflood, primary heavy oil in Saskatchewan and conventional light oil in Kazakhstan. Hompoth earned a BS degree in mechanical engineering from the University of Saskatchewan.
|
|
| |
Nathan Kuhn is a Production Technologist for Suncor Energy, Inc. Kuhn is a graduate of the Petroleum Engineering Technology course at the Northern Alberta Institute of Technology.
.
|
|
| |
Bruno Pinguet, based in Maturin, Venezuela, is the Worldwide Multiphase Domain Champion for Schlumberger. Pinguet earned a PhD degree in fluid mechanics from the Université Pierre et Marie Curie in Paris.
|
|
| |
Elsie Guerra is a Multiphase Metering Product Champion For Schlumberger, based in Calgary, Alberta, Canada. Guerra earned a BS in chemical engineering from the Universidad Simón Bolivar in Venezuela.
|
|
|

