Production Technology
Winning the battle against unwanted production
A comprehensive review of Conformance Engineering. Part 1: Understanding the problem.
David Smith, Oxy Permian, Houston; Bill Ott, Well Completion Technologies
A comprehensive approach to Conformance Engineering, otherwise known as the battle against unwanted production, will be presented over the next three issues. The hope is that this series creates discussion within the industry and assists efforts to control unnecessary water or gas production. In general, these articles focus on problems associated with water conformance, but many cases with gas floods have similar needs.
OVERVIEW
With focused Conformance Engineering efforts, there is general agreement that the most critical element of solving conformance problems starts with understanding the problem. People often come to us saying that they have a “water” problem. We try to change their perspective by telling them that water is only a symptom of the problem. At that time, we don’t know if this is “good water” or “bad water.” Good water may be defined as water that is part of a normal flooding process, which is also bringing some reasonable amount of oil. With that distinction made, we focus on the process of understanding the problem and, if appropriate, generate a solution.
We realize this seems very simplistic, but our experience has been that we often get lost in the trees if we don’t focus attention on the forest. You should remind yourself of two questions throughout the entire conformance control effort:
- How is fluid moving through the reservoir and why?
- How does the wellbore, both past and present, interact with the reservoir?
In many cases, making simplifying assumptions about these two questions leads to unproductive efforts. Remember to keep an open mind to the possibilities of how these issues interact. The following sections attempt to compartmentalize the elements to gain this understanding, to allow focusing on compiling and correlating the various components.
RESERVOIR CHARACTERIZATION
Whether dealing with a single well or total field production, experience shows that a good review of the overall field geology and trends is a good place to start. It adds value to the basic understanding of how the water (or gas) is moving through the reservoir and into the wellbore. Thus, we try to start with a good geologic description, typically defined as reservoir characterization, which involves everything from log analysis, core analysis, seismic interpretation, etc.
Understanding the nature of the depositional environment leads to a better understanding of the fluid movement. This includes the layering and post-depositional alterations, as well as mechanical alterations, such as faulting and fracturing. Without this understanding, it is difficult to properly characterize or envision the flow paths. Hand-in-hand with reservoir characterization, is following the reservoir production history, referred to as reservoir monitoring.
Reservoir monitoring measures volume (all three phases – oil, gas, water), pressure and time. Rate, of course, is a discreet value of volume vs. time. There are various methods of plotting and analyzing this data, but that is an entire discussion of its own. Listed below are analysis plots that we like to review to help understand fluid movement, etc. Missing this data and analysis severely limits attempts to determine how fluid is moving in the reservoir. Knowing whether the material balance calculations are indicating containment or losses outside a pattern is critical. The ability to compare pattern performance from one area of the field to another also helps define the potential nature of your problems, or at least where the most severe problems exist.
- Oil rate vs. cumulative oil (by pattern or by individual producer)
- Water oil ratio vs. cumulative oil or percent recovery
- Recovery factor vs. hydrocarbon pore volume, injected
- Injection to withdrawal ratio vs. time
- Basic decline curves, e.g., production rate vs. time
- Productivity index or injectivity index vs. time.
There is also value in knowing the character of the three phases, since changes may indicate shifts in reservoir flow. Also, formation waters from different zones often have a distinct character. A simple, yet often effective, conformance diagnostic tool can be trace-element water analyses or maybe a temperature survey. Using these tools, for example, might easily diagnose a case of sudden massive water breakthrough as a casing leak or channel.
After reviewing the available reservoir monitoring data, there may still be a lot of areas where we would like a more detailed understanding. In these cases, we often turn to reservoir testing.
Reservoir testing. The basics of reservoir testing are to first establish some baseline measurement of a physical parameter or character, and then induce some form of energy or material into the system that is trackable, and monitor the responses within or across the reservoir. Again, there is a plethora of reservoir testing procedures that can be performed. Listed below are some of the key testing approaches that can add significant value for Conformance Engineering:
- Pressure testing or pressure transient analysis
- Build ups and falloffs
- Pulse or interference tests
- Seismic testing
- 4D seismic
- Crosswell tomography
- Interwell tracer testing.
One of the key differences between reservoir monitoring and reservoir testing, is the time reference of the data. In general, reservoir monitoring occurs over a large timeframe. Reservoir testing generally takes place over a discreet, usually short time period. This is important, as the properties or characteristics of the reservoir and its interaction with the wellbore are often changing. Production and/or injection logs can be a sort of reservoir test. Such data are discussed in the section on wellbore monitoring, below.
This brings us to the second question of Conformance Engineering: How does the wellbore, both past and present, interact with the reservoir? To focus attention on the nature of this relationship, we again have broken the information down into three basic elements: wellbore description; wellbore monitoring and wellbore testing.
WELLBORE CHARACTERIZATION
As in analyzing reservoir flow, it is also important to understand characteristics of the wellbore completion.
Wellbore description. This starts with how the well was drilled. Drilling breaks and lost circulation occurrences often provide understanding about the wellbore and its interaction with the reservoir that cannot be correlated from any other data. Well logs, including cement bond log data, can give you insights to the potential for channels. Other completion data, including how the primary cement job was executed and the character of the cement, all contribute to this understanding.
Historical data on workover operations and other wellbore treatments, such as acid treatments and induced hydraulic fractures, clearly aid in understanding the potential nature of conformance flow problems. In contrast to reservoir description data, wellbore description data is very time dependent.
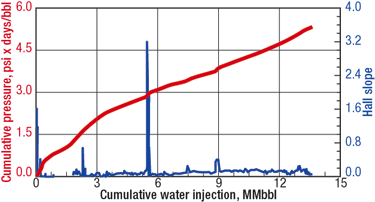
Wellbore monitoring. Frequently, the data used for reservoir understanding can also help characterize the wellbore’s interaction with the reservoir. In addition, other data can be used, such as temperature anomalies, along with flow-profiles from production or injection logs. Profile logs can be categorized as a form of wellbore testing, however, with sufficient frequency, they provide a form of interval flow monitoring that is also closely tied to the reservoir. The key data are again volume (all three phases), pressure, time and, of course, rate as discussed earlier. Although there are still various analyses that can be used to characterize the wellbore, a couple that we like are Productivity Index or Injectivity Index vs. Time, and Hall Plots.
Figure 1 is a Hall Plot that clearly shows water-production changes taking place mainly in the wellbore or near-wellbore region. A key parameter is good, average reservoir pressure data. Without this information, these plots may yield an incorrect interpretation. As in the case of understanding any problem, there often comes a point where the usual available data will not provide enough information for confidence in understanding the flow problem. This leads to wellbore testing.
 |
Fig. 1. Typical Hall Plot.
|
|
Wellbore testing. We use a definition similar to reservoir testing, that is, establish a baseline understanding and then induce some change to the wellbore that can be monitored. Various cased hole logs can be considered a form of wellbore testing. Whether simple caliper logs to evaluate casing damage, or more sophisticated tools such a 3D sonic imaging, these logs can be valuable. Some of the most useful are:
- Water flow logs (RA pulse, tags water flowing in the wellbore and then monitors its progress)
- Casing inspection logs
- Multi-arm calipers
- 360° sonic imaging
- Camera inspection (video logs)
Other tests that provide data on the wellbore condition were mentioned in the reservoir testing section, because the data they provide are again linked to both the reservoir and the wellbore, e.g., a pressure transient analysis associated with falloffs and buildups. The wellbore storage and skin factors can often be integrated into a more comprehensive understanding of the problem. Recent efforts to use wellbore storage data, to characterize the entire void space connected to the wellbore, have shown significant features that would have otherwise been ignored.
INTEGRATING INFORMATION/ ASSUMPTIONS AND EXAMPLES
The above sections about the reservoir and the wellbore have been kept short and in outline form, because there is no way to do justice to all of the elements that are contained within each subsection. In addition, if you have had good technical training in your degree or within your company, you have already spent considerable time learning very intricate details of many of these methods or tests.
What we suspect has not been aggressively covered in the literature, or in your training, are the most difficult aspects of dealing with conformance problems, and trying to integrate all of the information into a comprehensive reservoir picture and wellbore flow mechanics. In this process, we are often faced with missing or limited information, which forces us to make assumptions. These assumptions can be as simple as, “We have a good primary cement job,” or “The casing is only two years old, so there is no way we can have a casing hole,” or as encompassing as, “All core, log, seismic and other reservoir description data indicated there are no natural faults or fractures.” In many cases, these basic simplifying assumptions can become the critical piece to formulating an ineffective solution.
It has been our experience that, failing to generate an effective conformance solution, post treatment analysis ultimately shows that it was not the solution technique that failed. The shortcoming was a misapplication of the technology, because the problem was misunderstood. Some areas where these studies have gone to the extreme have shown that ~75% to 80% of the time, when a solution is unsuccessful, it was due to misunderstanding the problem, and only 20% to 25% is due to poor execution of the solution or technology. The bottom line is: Products and technology, in general, don’t fail; we do. We fail to be able to properly characterize or diagnose the problem, and the end result is a failed application of the technology. The following couple of experiences help make this point.
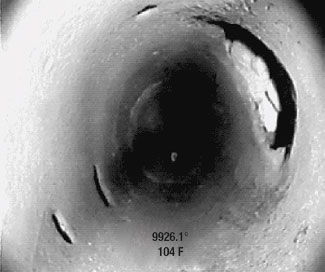
CT squeeze. A coiled tubing cement squeeze was attempted of an interval that was believed to have uniform perforation tunnels. The treatment failed. The area where this occurred used CT squeezes routinely. In one case, we found large blast holes as shown in Fig. 2, and in the other, we found a casing split. Alternate solution methods were designed and were effective in both cases, once the problem was clearly understood.
 |
Fig. 2. Uniform perfs were thought to exist in this Alaskan well. But large blast holes at 9,926 ft prevented a good squeeze job.
|
|
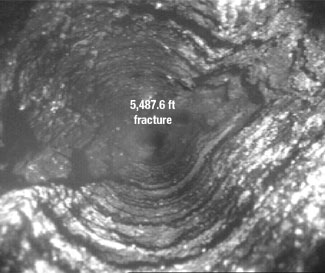
Huge voids. For years in one field, we attempted to repair openhole wellbore conformance problems with relatively small volumes of fillers and gel, because we believed that there was no significant void. All virgin discovery data and analysis of the formation had indicated no potential for significant fracturing or rock dissolution. Comprehensive diagnostics, including a complete review of past treatments, and their results, along with interwell tracers, step-rate tests and wellbore camera inspections, provided a different understanding of the problem. Massive open fractures were present, believed to have been induced by pressure and dissolution of rock, Fig. 3. This new understanding led to a solution that involved 8,000 bbl of high-molecular-weight gels and 2,000 bbl of foamed cement.
 |
Fig. 3. Thorough analysis revealed massive open fractures, induced by pressure and dissolution of rock.
|
|
As a final method of problem diagnostics, we contend that post-treatment job performance can play an integral part in the overall conformance effort. We will discuss more about this in Part 3.
INDUCED FORMATION CHANGES
This brings us to an additional point. Production engineers sometimes feel that little or no changes occur to the formation over the time of field exploitation. However, conformance problems and experience indicate otherwise. This is especially true in the near-wellbore region. We contend that flooding with solvents, water or CO2, pressure depletion, re-pressurization, sand production, injection of solids, etc., can affect the formation and impact conformance problems. These human-induced diagenetic features are, in most cases, void-space in nature, but some can result in formation plugging or permeability enhancement.
For many years, we have studied clay swelling problems with intensity. We have observed water-compatibility problems causing major damage in waterfloods, where these issues were not addressed. However, less effort has been placed to understand and/or characterize these stimulating waterflooding effects, simply because they are initially beneficial to the flood. These properties are not measured by the virgin rock discovery data. This is evidenced by the number of times that reservoir simulation modeling, typically built on virgin reservoir data, has to be aggressively manipulated, either by large skin factors on the wells or by incorporating extremely fast layers to achieve a history match with the flood data.
If we consider the influence that these features can have on conformance, you can easily see how properly characterizing them can become critical to the solution one might design to alter this flow mechanism. Many of the testing tools available to us today are not designed to evaluate or analyze these features. Deep reservoir influences are, at present, beyond our ability to evaluate, except through very costly and somewhat experimental processes.
Part 2 will discuss, in more detail, several of the major conformance problems that exist in the industry. We will characterize these problems in a problem matrix and discuss the range of solutions that exists to address these problems. 
|
THE AUTHORS
|
|
David Smith has been the senior conformance engineering advisor for OXY Permian for the last four years. His industry experience includes 18 years with ARCO, mostly at Prudhoe Bay, where he was a well supervisor overseeing coiled tubing operations, and later led the non-rig workover group. Thereafter, he worked for Halliburton, as project manager for conformance engineering. In late 1999, he returned to OXY at Elk Hill. He now works as an in-house consultant for conformance solutions that are beyond the scope of normal operations. Mr. Smith is co-chair of the EOR/IOR Technical Interest Group for SPE, of which he is a member. He earned a BS in geology from Pacific Lutheran University and an MS in petroleum engineering from Stanford University.
|
|
| |
William K. (Bill) Ott is founder (1986) and president of Well Completion Technology, a Houston-based international petroleum industry consulting and training firm. Previously, he was training manager for Triton Engineering Services, and division engineer for Halliburton’s Far East region. Mr. Ott received his BS degree in chemical engineering from the University of Missouri. He is a registered professional engineer in Texas and Missouri and a 25-year member of SPE.
|
|
|


