Five energy myths. The popular and, yes, even the oilfield press, can be very confusing.
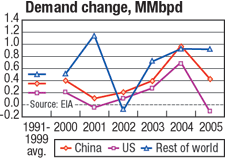
Chinese and US oil demand is surging. We were told by the governmental agencies, EIA and IEA, and numerous pundits and press media, that US demand was healthy and Chinese demand was soaring. As 2005 progressed, it became obvious that in fact, Chinese demand was plummeting from its lofty 2004 levels, and US demand actually finished the year in negative territory, as Fig. 1 shows. I still read new stuff about soaring US and Chinese demand. And both agencies are again forecasting a return to high demand growth. By the way, world demand for 2005 was 1.5% – right in the middle of its “typical” range for the last 25 years. Bear in mind that the actual number, whether 1, 2 or 3%, is paramount, and has a profound effect on supply and demand forecasts, psychology and, thus, prices. Obviously, predicting oil demand is an art; the folks at these agencies must like to live dangerously. This brings up another story: How can the US economy grow by over 3% with negative oil demand? Aren’t we told that energy consumption and economic growth go hand-in-hand? Yes, but graphs of the relationship usually cover a timescale of centuries, with a resolution of a few years. There’s a not-too-well publicized quantity called energy intensity, which is basically the amount of energy used per unit of GDP.
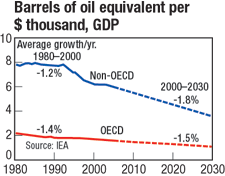
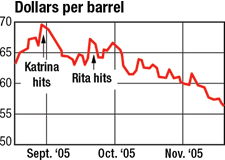
Beginning with the oil embargo of the early 1970s, energy use, through energy intensity, became somewhat decoupled from economic growth. I suspect that 2005’s energy intensity improved quite a bit, but those numbers aren’t in yet, Fig. 2. Since 1971, the world economy has grown at 3% annually, while oil demand increased at only 1.5%. Everyone knows that the recent hurricanes caused oil prices to rise. Actually, the price of oil fell after Katrina, as Fig. 3 shows. Stranger still, Rita measurably destroyed more of the Gulf of Mexico, and had a more pronounced effect on production, than any other hurricane. The Strategic Petroleum Reserve helped replace, at most, only about 15% of the 133 million bbl of hurricane-related production lost thus far. Even adding in the most optimistic numbers from IEA-member stock drawdowns, it’s still less than half of what was lost. Prices eventually did rebound, but these were ostensibly blamed on troubles in Nigeria and Iran. Inventory levels continue to rise. I can’t even begin to predict what prices will be in the two weeks between when this is written and when you read it, but if they stay high, it’s unlikely due to any real shortage.
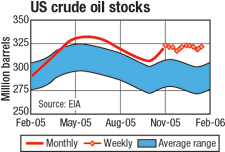
Oil supplies are tight. This one has been the hardest to justify during most of 2005, especially in the second half. Crude stock levels in the US have easily been within their five-year averages, in fact, well above five-year average levels, Fig. 4. In its short term energy outlook of January, the US EIA really underscored the difficulty of its task. It was a real “soup” of divergent possibilities. The agency forecast “continued market tightness,” “World spare oil-production capacity is projected to increase during 2006 and 2007,” “Prices for crude oil . . . are projected to remain high through 2006 before starting to weaken in 2007.” “US demand is projected to recover from a net decline in 2005 to show growth of 410,000 bopd in 2006.” US refining capacity is flat. This is usually preceded by, or is at least the intent behind, the frequently used statement, “There hasn’t been a new refinery built in the US in 30 years.” The number of refineries is not particularly important.
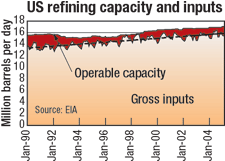
Refineries have been expanding within and around their existing locations, and efficiency is also up. As Fig. 5 shows, refining “capacity,” however defined, has been trending upward nicely over the last 15 years. Beware of any comparison to the peak period in all things oily, namely, 1981-’83. Small refineries that were limited to simple distillation were only profitable via federal subsidies. These ended in 1981. Subsequently, these unprofitable plants began to close. “Conventional wisdom” gets it wrong so often that I wonder how many of the debunked myths presented here have a basis. After all, in many cases, it’s the same conventional wisdom that’s now calling itself wrong.
|
|||||||||||||||||||||||
- Prices and governmental policies combine to stymie Canadian upstream growth (February 2024)
- U.S. producing gas wells increase despite low prices (February 2024)
- U.S. drilling: More of the same expected (February 2024)
- U.S. oil and natural gas production hits record highs (February 2024)
- U.S. upstream muddles along, with an eye toward 2024 (September 2023)
- Canada's upstream soldiers on despite governmental interference (September 2023)


