OUTLOOK 2006: United States
US reserves
US oil reserves down, gas up, again
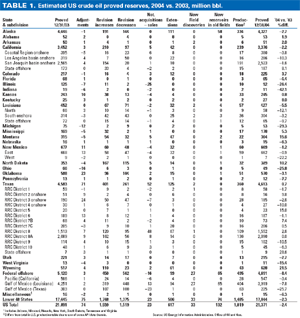
US proved crude oil reserves fell 2.5%, or 520 million bbl, in 2004, worse than last year’s drop. Five of the last 10 years have seen declines in oil reserves. Reserves only replaced 71% of production; still, that was better than the prior year’s 58% replacement figure.
NGL reserves, which are not accounted for in these tables, comprise one-fourth of hydrocarbon liquids reserves. These grew 6% in 2004, reversing their prior-year decline.
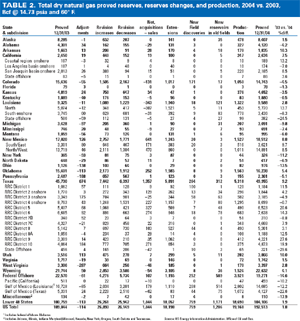
Proved dry natural gas reserves increased for the sixth consecutive year, adding 1.8%. This is the ninth increase in the last ten years. Moreover, reserve additions topped gas production by 18% in 2004. As always, it takes nearly a year for the US government to gather and analyze reserve data; so, 2005’s reserves will not be ready until year-end 2006.
Crude reserves. One surprising factor: prices are not having any overt effect on reserves, especially oil reserves. This, despite the fact that year-end prices are supposed to be used in calculating reserves. But whether companies are using average prices or year-end prices, oil was about $10 more, on average, than in 2003, which was also $10 more than the price in 2002. This lack of price effect on reserves is even more puzzling given the fact that, as EIA puts it, “Since 1977, crude oil reserves have primarily been sustained by proved ultimate recovery appreciation in existing fields, rather than by discovery of new oil fields. Only 12% of reserves additions since 1977 were booked as new field discoveries.” One would think that recovery factors are very price sensitive.
 |
| |
TABLE 1. Estimated US crude oil proved reserves, 2004 vs. 2003, million bbl.
Click image for enlarged view |
|
|
|
The Gulf of Mexico contributed the most to the national decline, losing 429 million bbl. Alaska continued its steady downward drift, falling 119 million bbl. The Lower 48 held steady, while a few areas saw additions. Wyoming contributed the most, adding 111 million bbl, followed by Montana’s 49 million, North Dakota’s 36 million and, surprisingly, Texas, which gained 30 million bbl of reserves.
Natural gas. Total discovered gas reserves were 3.5 Tcf – a 5% increase – more than in 2003, despite a drop in offshore gas reserves. Most of the additions came from extensions in conventional and unconventional reserves.
 |
| |
TABLE 2. Total dry natural gas proved reserves, reserves changes, and production, 2004 vs. 2003, Bcf @ 14.73 psia and 60° F.
Click image for enlarged view |
|
|
|
Although reserves increases have surpassed production for each of the last six years, gas imports continue to creep up, and production has struggled to keep flat, at about 19 Tcf a year. The explanation for this is because unconventional resources are playing an increasing role in gas production. Tight sands, shales and coalbed methane wells, while being vast in area and contributing to increased reserves, are low on deliverability.
Coalbed methane proved reserves edged 2% lower in 2004, the first downturn in 11 years, and only the second over two decades. CBM proved reserves account for 10% of all US gas reserves. Five states – Alabama, Colorado, New Mexico, Utah and Wyoming – account for 86% of CBM reserves. CBM production increased another 8% in 2004, to 1.7 Tcf, accounting for 9% of national gas production. 
|


