Drilling Technology
New API labeling describes shale shaker screens
Designations are now linked directly to particle size.
Leon Robinson, Petroskills and Mark Morgan, Chevron, Houston
Shale shaker screens have become complicated during the past 40 to 50 years, Initially, they were simple square openings that were easy to describe. At that time, screens were designated by "mesh" openings. The mesh count is the number of openings per inch in directions perpendicular to each other and parallel to the screen wires, For example, a 40-mesh screen would have 40 openings per inch in one direction and 40 openings per inch in a perpendicular direction, In an effort to eliminate calling the screen a "40 by 40" screen, the common terminology resulted in calling the screen a 40-mesh.
HISTORY
 |
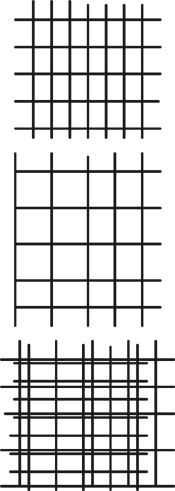
Fig. 1. Shale shaker throughput was increased by mounting one screen on top of another, which created a description problem because of non-uniform openings.
|
|
During the 1960s, the throughput volume was increased by making rectangular openings. If the mesh count was 20 openings in one direction and 40 openings in a perpendicular direction, the screen would be labeled a 20x40 mesh, The marketing ploy, however, was to label the screen with a letter and then the number 60. This implied to many that the screen was a 60-mesh screen, although this was not stated explicitly. Rig crews were happy because the "fine-mesh" screens could handle more flow than a normal, square-mesh screen. The primary purpose of a shale shaker – to remove solids – was obscured.
After rectangular screens became common, shale shaker throughput was increased again by mounting one screen on top of another screen instead of using only a single layer, Fig 1. This layering created even more of a description problem, because the openings were now non-uniform and difficult to describe. In the sketch, one square mesh screen is shown superimposed over another square mesh screen. A variety of opening sizes resulted that cannot be described by a single number.
In an effort to better describe multi-layered shaker screens, API issued API RP 13E in May 1993. This procedure called for use of an Image Analyzer to determine the distribution of openings in the screen cloth. An Image Analyzer consisted of, in part, a microscope, a light table, a computer with appropriate software and a video monitor. A multilayered screen was placed on the light table, and 1,500 openings were selected. The width and length of these openings were measured, and the readings were converted into a volume of an ellipsoid that would fit into each opening. The volumes of these ellipsoids were converted to spheres of the same volume, and then the diameters of these spheres were calculated. The cumulative ellipsoid volume is plotted as a function of the "equivalent spherical diameters."
The values reported were d50, d16, and d84 from the distribution. The d50 is the median spherical diameter, where 50% of the imaginary spheres are larger than that diameter and 50% of the imaginary spheres are smaller than that diameter. The values of d16 and d84 were selected because they are one standard deviation from a Gaussian Distribution Mean.
A cut point curve represents the fraction of solids in various size ranges that is discarded by a screen, compared to the fraction of solids in each size range that is presented to the solids removal equipment. Particle size is on the x-axis, while the discard solids ratio is on the y-axis. An actual cut point is labeled with a capital "D." A lower case "d" was selected under API RP 13E to distinguish the "separation potential" of different screen types.
A cut point value of a D50 identifies the particle size whose total mass is split equally by the screen: 50% of the mass is discarded and 50% continues in the recovered stream’s flow.
The separation potential curve resembles the general shape of a cut point curve, but it is merely a distribution of opening sizes. The cut point curve describes equipment performance for a particular shaker, screen, flowrate and liquid properties. It is not a constant for a particular screen.
To emphasize: A screen does not have a unique cut point. A 40x40-mesh screen does not have a 40-mesh cut point. The cut point could be much smaller, depending upon many factors.
API RP 13E’s distribution of openings has never been shown to relate to actual screen performance. It was an artificial method of finding the distribution of imaginary spheres that would have the same volume as the openings in a screen. Unfortunately, it had no relation to the distribution of solids rejected or passing through the screen. Solids do not seek apertures exactly their size; small solids easily pass through larger apertures. Sieving or screening criteria are related to the largest openings in the screen.
THE NEW API RP13C
API Subcommittee 13 decided to examine this procedure again after abandonment of the only image analyzer that was built for this purpose. In August 1999, a new Task Group was formed to combine RP13E with the solids control document RP13C before it was presented for ISO consideration. The group decided that a different method was needed to describe shale-shaker screens. Companies and individual committee members meticulously examined many concepts and donated many hours to testing and validation.
A comprehensive document was approved by API and published in December 2004 and approved by ISO in 2006. Two major changes were incorporated into the Recommended Practice:
- Conductance measurement was made more robust
- A new shaker screen description method was instituted.
Most companies were in accord with the first new procedure. Discord arose, however, with the new description method. This arose because most screen manufacturers and solids control service providers now needed to label their screens as coarser than their original designation. Some screens labeled as "XX175" (implying a 175 mesh) would not capture even 100-mesh particles.
The committee’s first quest was to describe shaker screens in performance terms. On the drilling rig, people are interested in how many drilled solids are discarded and what the screen’s fluid capacity will be. After many in-depth discussions, the committee decided that a performance test to describe all field circumstances was not possible. There are too many variables to design simple performance tests.
For example, the wetted boundary layer around the screen wires affects the cut point. Drilling fluids are usually non-Newtonian. In stagnant regions, these fluids have a very high viscosity and in rapidly flowing streams they have much lower viscosities. They form a wetted boundary around the wires in a shaker screen that depends upon the drilling fluid’s ingredients. When a shale shaker screen becomes water-wet while processing a non-aqueous fluid (NAF), the openings appear much smaller to the flow and a smaller quantity of liquid and solids pass through. In very fine screens, most of the NAF will flow off the end of the screen.
Cut points are not a unique property of shale shaker screens. Other parameters also have an impact including:
- Liquid phase viscosity at the shear rate required to move through the screen
- Screen velocity and acceleration
- Deck angle
- Screen motion
- Solids loading and solid sizes presented to the screen
- The gel structure of the drilling fluid, among others.
The Task Group discussed using a generic motion, a simple generic drilling fluid containing sand and establishing guidelines for analyzing the discarded solids. Clearly, a generic fluid could not be developed that would apply to all field conditions. So, the Task Group decided to describe only the shaker screens in a coherent, reproducible manner, instead of trying to identify performance.
All screens have some distribution of openings. The Task Group decided to identify the largest solid that would pass through each screen (or the smallest solid captured by the screen); this is called D100. Solids smaller than D100 will pass through a D100 screen. If a screen is labeled as 200-mesh (74 microns), no 100-mesh (150 micron) particles should pass through the screen. Clearly all 80-mesh (180 micron) particles should not pass through the screen. If openings are 74 microns by 74 microns, larger particles should remain on the screen.
The goal was to describe the size of the screen openings. Most particle sieving and sizing is related to some standard opening sizes. Opening sizes, for example, in a 200x200 mesh screen will depend upon wire thickness ASTM Specification E-11 serves as an accepted standard to describe screen openings. The Task Group wanted to create a standard method of describing screen openings that would be reproducible around the world and would be relatively simple.
On a shale shaker, the drilling fluid residence time is relatively short, but solids separation on the screen will still depend upon the largest openings available for solids to pass through. A median cut point, such as D50, D16 or D84, will depend upon the distribution of solids presented to the screen. Therefore, the group decided that the D100 would be used for reporting the opening size. This number represents the largest particle that would not pass through the screen.
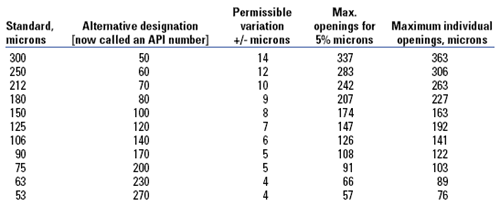
In Table 1, the alternative designation is the number that originally indicated mesh size. Since the numbers are converted to metric units, to become ISO standards, inches can no longer be used. Mesh refers to the number of openings per inch. Converting that number to the number of openings per meter or centimeter would create a strange and incomprehensible number.
| TABLE 1. ASTM specification E–11 (partial list) |
 |
|
ASTM labeled the mesh number by an "alternative designation." API documents are being converted into ISO standards. This API 13C Task Group was one of the first to write its document in ISO format, allowing for conversion. To avoid confusion at the rig, the label indicating the number of openings per inch was converted into an API number. A screen with 74-micron by 74-micron openings would be called an API200 instead of a 200-mesh screen.
The Task Group thought that if a screen was labeled "170-mesh" that it should retain all particles larger than 90 microns in size. Unfortunately, testing some commercially available screens sold with this number found that not even 150-micron size particles were captured on the screen. Large openings in the screen allowed those particles to pass through.
REPRODUCIBLE METHOD
The next goal was to find a reproducible method of measuring D100 for any shaker screen. The most common material available around the world is sand. It is available worldwide in great abundance, but sand has many different shapes depending upon geographical location. A series of blind reproducibility tests was performed using sand.
Four different companies mounted four of their fine screens in holders, and each sent three samples to the other three companies with no screen labels. The sand came from different sources, and had different shapes and smoothness. The results were very discouraging. Using a simple Ro-Tap test, results were not reproducible. This left the Task Group with two options: developing a single source and the resulting distribution nightmare, or finding another standard grit.
The next two grit choices were glass beads and aluminum oxide. These can be purchased in specific size ranges. Again, four companies provided screens for testing, and four companies performed the tests on the unmarked screens samples. The aluminum oxide data were reproduced in all but one test, Table 2.
| TABLE 2. Aluminum oxide used as test grit. |
 |
|
The glass bead test data, however, were reproduced in only one test. These data indicated smaller openings in the screens than did the aluminum oxide, even though the numbers were not consistent from one company test to another. Naturally, screen manufacturers would want to use the glass beads as the test grit instead of aluminum oxide, Table 3.
| TABLE 3. Glass beads used as test grit. |
 |
|
In tests, it was discovered that glass beads acquire static electric charges. When glass beads were washed, dried and resorted on standard ASTM screens, both media resulted in the same screen designation until the glass-bead, electric charges reappeared. Aluminum oxide gave the same answer, whether or not it was washed, Table 4.
| TABLE 4. Comparative testing with glass beads and aluminum oxide. |
 |
|
Glass beads have a nice round shape resembling cuttings that have remained in the borehole too long. When cuttings tumble in the annulus, poor hole cleaning produces excessive rounding of the drilled cuttings’ sharp edges. In other words, wells with poor drilling practices would have their shaker performance represented better by glass beads.
Aluminum oxide grit closely resembles shale cuttings that are transported expeditiously from the bottom of a bore-hole. However, the primary reason that this grit was chosen was the ability to reproduce data and accurately represent the opening sizes in screens. As an additional benefit, the material is easy to use and available at a very low cost, Fig. 2.
 |
Fig. 2. Glass beads and aluminum oxide were tried as test media. Aluminum oxide grit closely resembles shale cuttings.
|
|
DETERMINING EQUIVALENT SIZES
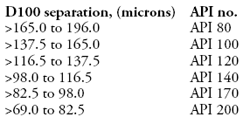
The API-recommended procedures are published in API RP 13C, Third Edition, December 2004. A test screen is mounted on a RoTap, or equivalent vibrator, with two ASTM screens above and two ASTM screens below, arranged so that the coarsest screen is on top and the finest is on bottom, The assortment of test grit, which was previously captured on the ASTM screens, is dumped onto the top screen, and the stack is vibrated for 10 min. The weight of the grit captured on the test screen is used to determine the D100 separation by the test screen. The value of the D100 separation usually falls between two sieve openings. When the D100 separation falls at a point that is one-half or less of the difference between the openings of a finer and the next-coarser sieve, the test screen is rated as the finer screen. When the D100 separation falls at a point that is more than one-half the difference between the openings of a finer and the next-coarser sieve, the test screen is rated as the coarser screen.
API numbers related to D100 separation (partial list) are as follows:
RESULTS OF THE NEW SCREEN DESIGNATION
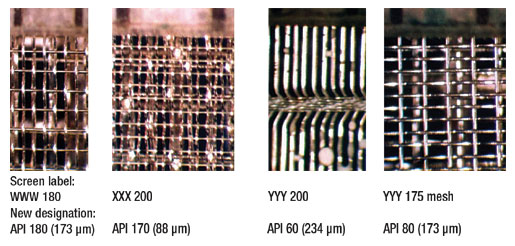
Microscope pictures of four commercially available screens are shown with their catalog designations, Fig. 3. The letters that normally precede the number have been randomly changed to WWW, XXX, YYY and ZZZ. The opening sizes vary significantly, and each screen has a different flow capacity. However, the primary purpose of a shale shaker screen is to remove drilled solids. In the same drilling fluid, on the same shaker, it seems self-evident that screens with smaller apertures would remove more drilled solids. What is surprising is that some vendors are raising confusing arguments and trying to convince customers that larger openings can remove more solids. Large openings in a screen will increase the fluid capacity of a shaker, while larger diameter wires will increase screen life.
 |
Fig. 3. Four commercially available screens show that opening sizes vary significantly.
|
|
CUT POINTS
A cut point is not a unique value for a shaker screen, hydrocyclone or centrifuge. A wetting fluid layer surrounds each wire, which changes the apparent opening size available for flow and affects the cut point. The cut point curve for a hydrocyclone is a very strong function of the fluid viscosity and total solids loading.
For example, a cut point for a 4-in. desilter with sand and water is about 16 to 20 microns. If the mud weight is increased to around 11 ppg with barite, this cut point would become impossible to achieve. The underflow of the desilter would need to contain an extremely large quantity of barite. With 50 gpm passing through the cone and 1 gpm discarded from the bottom of the cone, the D50 cut point is much higher than 20 microns.
WHAT THE NEW TEST DOES NOT DO
This new screen designation only describes the largest size of solids captured on the screen. It does not attempt to describe screen performance on a shale shaker. Unfortunately, many screens were labeled with information that would lead the user to believe that the openings were much smaller than they are. The solids used in these tests are captured on an ASTM-standard, square-mesh screen and sorted before being placing on a test screen. If a screen is labeled 200-mesh, it implies an equivalent opening size of 74 microns. When particles larger than 100 microns fall through this screen, the labeled opening size is misleading.
In the above example, a screen labeled YYY200 was not a 200-mesh screen. This screen only captured solids larger than 234 microns (or a square, 60-mesh ASTM screen). All particles that would normally be captured on a square, 70-mesh ASTM screen fell through this screen. The screen’s fluid capacity should be much higher than a screen with 74-micron (200-mesh) openings.
Almost all screens tested by the new method have larger openings than suggested by their current labeling. Naturally, many of the service companies and screen manufacturers are disgruntled with the "downgrading" of their screens. Most, however, see the wisdom in trying to identify the largest particles that will pass through the screen. This gives a true comparison of screen openings versus a well-recognized standard.
SUMMARY
The API RP13C is a screen description and does not predict the performance of screens on a shale shaker. It is intended only to provide a comparison of shaker screen opening sizes. However, if the openings in one screen will pass 200-micron particles, and another screen does not permit 74-micron particles to pass, logic dictates that, under identical field conditions, the screen with the smaller openings will remove more solids. The new API test is simply a method of describing how a screen compares to a square-mesh ASTM standard.
API RP13C provides a physical test that can be used for non-conventional screens that may be developed in the future. If a company produces a screen with triangular, hexagonal or even octagonal openings with triangular or pentagonal wires that are curved, they will have a method of describing their new development by comparing it to the same standard as other screens on the market. 
|
THE AUTHORS
|
 |
Leon Robinson retired in 1992 after 39 years with Exxon Production Research. He is a drilling instructor with Petroskills, chairman of the API Task Group 5 (Solids Control), SPE Drilling Waste Management Steering Committee member, Program Committee member for the 2007 National AADE Technical Conference, and chairman of the IADC Technical Publications Committee. Robinson earned a BS degree in 1949, an MS degree in physics in 1950 from Clemson University and a PhD in engineering physics from North Carolina State.
|
|
 |
Mark Morgan is a drilling fluids/ solids control/ waste management specialist for Chevron. Morgan has 29 years’ experience working for both major oil companies and service companies. He earned a BS degree in professional aviation from Louisiana Tech University and later completed petroleum engineering training at the University of Southwestern Louisiana.
|
|
|


