OUTLOOK 2004: United States
US Rotary Rigs
A good year should get even better
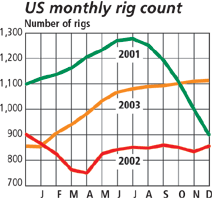
By almost any measure, 2003 was a good year to be in the drilling business, and it's ending on a high note, with 2004 set to go even higher. The year began with 845 rigs and ended with 1,126a – 33% increase – in stark contrast to 2002's remarkably flat levels. Except for 2001, this is the highest average number of US rigs running since 1985. As the yearly curves show, the buildup in 2003 was relentless, without any backsliding.
Colorado, New Mexico, Wyoming, Oklahoma and Texas gained the most activity (in terms of rig count), adding a collective 193 rigs on average, without a significant reduction in any state. Oil prices, of course, get the credit for this considerable rise in rigs.
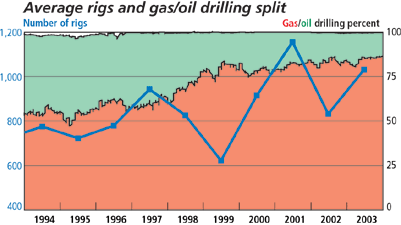
The gas/oil-directed drilling split may be nearing a plateau, as the ratio stayed near 84 – 86% most of the year, beginning in 2004 at 87%.
Last year we predicted an average 870 rigs – a modest 5.5% increase. We were way too pessimistic, since the 2003 yearly average was 1,032. In terms of yearly averages, that's a 24% rise from 2002. For 2004, World Oil estimates that 33,470 wells will be drilled, a 9.7% increase from 2003. This should require about an average of 1,130 rigs which, according to the ReedHycalog rig census in our October issue, should not be a problem, since it found that there were up to 1,700 rigs available for use. This forecast factors in an incremental increase in rig efficiency. 
 |
| |
Average number of US rotary rigs in operation 1 |
|
| |
State or area |
2003
Avg. |
2002
Avg. |
% Diff. |
|
| |
|
|
| |
Alabama–Onshore |
1.6 |
1.0 |
62.5 |
|
| |
Alabama–Offshore |
0.8 |
2.0 |
–59.2 |
|
| |
Alaska–Onshore |
8.9 |
9.7 |
–8.7 |
|
| |
Alaska–Offshore |
0.9 |
1.5 |
–42.2 |
|
| |
Arkansas |
2.1 |
0.8 |
… |
|
| |
California–Onshore |
17.9 |
19.7 |
–8.9 |
|
| |
California–Offshore |
3.2 |
2.6 |
24.8 |
|
| |
Colorado |
38.8 |
27.8 |
39.7 |
|
| |
Kansas |
8.7 |
7.5 |
15.7 |
|
| |
Kentucky |
4.3 |
4.8 |
–10.7 |
|
| |
Louisiana total |
157.0 |
162.7 |
–3.5 |
|
| |
North |
28.5 |
23.0 |
24.0 |
|
| |
Inland water |
14.3 |
16.0 |
–10.5 |
|
| |
South |
29.5 |
32.0 |
–7.9 |
|
| |
Offshore |
84.6 |
91.7 |
–7.7 |
|
| |
Michigan |
3.0 |
1.3 |
… |
|
| |
Mississippi |
8.1 |
7.5 |
7.5 |
|
| |
Montana |
14.0 |
7.9 |
77.2 |
|
| |
New Mexico |
64.7 |
41.5 |
56.0 |
|
| |
New York |
2.7 |
4.3 |
–36.1 |
|
| |
North Dakota |
13.7 |
10.1 |
35.5 |
|
| |
Ohio |
7.4 |
8.7 |
–15.3 |
|
| |
Oklahoma |
128.4 |
90.9 |
41.3 |
|
| |
Pennsylvania |
10.1 |
10.3 |
–1.8 |
|
| |
South Dakota |
0.2 |
0.2 |
… |
|
| |
Texas total |
448.9 |
340.9 |
31.7 |
|
| |
Texas offshore |
17.6 |
14.8 |
18.9 |
|
| |
Inland water |
2.5 |
2.0 |
25.8 |
|
| |
District 1 |
13.4 |
8.0 |
67.6 |
|
| |
District 2 |
26.4 |
21.0 |
25.6 |
|
| |
District 3 |
48.1 |
40.0 |
20.3 |
|
| |
District 4 |
78.7 |
74.0 |
6.3 |
|
| |
District 5 |
53.3 |
38.0 |
40.3 |
|
| |
District 6 |
54.0 |
31.0 |
74.2 |
|
| |
District 7B |
1.3 |
1.0 |
30.4 |
|
| |
District 7C |
27.1 |
21.0 |
28.9 |
|
| |
District 8 |
45.6 |
31.1 |
46.6 |
|
| |
District 8A |
15.4 |
14.0 |
10.1 |
|
| |
District 9 |
39.5 |
30.0 |
31.7 |
|
| |
District 10 |
26.1 |
15.0 |
73.7 |
|
| |
Utah |
13.5 |
13.1 |
3.1 |
|
| |
Virginia |
0.9 |
1.9 |
–51.1 |
|
| |
West Virginia |
15.5 |
13.2 |
17.6 |
|
| |
Wyoming |
53.7 |
40.2 |
33.7 |
|
| |
Others2 |
3.4 |
0.5 |
… |
|
| |
|
|
| |
Total US |
1031.0 |
832.7 |
23.9 |
|
|
|


