Using gravity gradiometry in seismic interpretation in pre-SDM
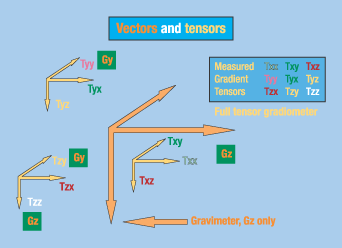
EXPLORATIONUsing gravity gradiometry in seismic interpretation in pre-SDMA case history in the Green Canyon area, offshore Louisiana, using full tensor-gradient-enhanced seismic interpretation on a pre-SDM modelGary W. Coburn, Bell Geospace, Inc., Houston; and Jeff Schneider, Texaco, Inc., Houston* U.S. production decline has spurred exploration efforts in increasingly difficult interpretation environments such as the deepwater Gulf of Mexico (GOM). To more accurately interpret seismic data in these areas, new technologies have been sought. One such technology is gravity gradiometry. Although gradient data has been extensively used since 1930, it was difficult and cumbersome because the data was collected using stationary measurements. In the 1970s, the U.S. Navy developed a moving gradiometer for positioning Trident nuclear-missile submarines. This technology was declassified in 1994, and is used in the energy industry today. Exploration and development of new deepwater GOM reserves have been hampered by extensive salt canopies, sheets and other salt bodies which absorb or redirect seismic energy, resulting in poor seismic imaging. Interpreting base-of-salt and subsalt structures is extremely difficult in many deepwater areas. Factors affecting subsalt imaging are: steep dips of the top-of-salt, rugose top-of-salt, salt structures with embodied sediments, reflection multiples and velocity insensitivity. To define salt bodies vertically and laterally, as well as subsalt structures, Texaco elected to incorporate Full Tensor Gradient (FTG) data in the seismic interpretation. Using FTG analysis allows the base of salt to be determined where it cannot be imaged by seismic alone. Gradiometry The moving gravity gradiometer was developed for the U.S. Navy by Bell Aerospace for use in Trident nuclear missile submarines, at a cost exceeding $250 million. Following its declassification, it was licensed and modified by Bell Geospace, Inc., for use in the oil and gas industry. Gradiometry data differs from conventional high-resolution gravity data in many respects, especially bandwith (600 m vs. 3 km for conventional gravity). The greatly increased bandwidth allows retention of high-frequency, short-wavelength signals generated by shallow-to-intermediate geologic features, which are not retained in gravity data. The increased sensitivity allows for much greater resolution and is the reason gradiometry data can be successfully incorporated into seismic interpretation at a prospect level. Tensor gradiometry data represents the first derivative of the gravity vector field. It describes the spatial rate of change of the vector field components in all directions. The gradient tensor comprises nine tensor components, but only five are independent, Fig. 1. In the tensor matrix, elements indicated by like colors are equivalent. Additionally, the calculated diagonal element Tzz equals the negative sum of the tensor elements Txx and Tyy (LaPlace Equation).
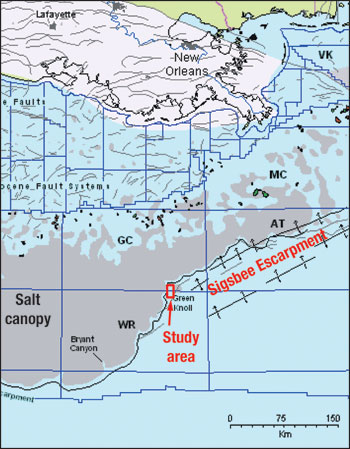
Each independent tensor component responds uniquely to the size, shape and thickness of density anomalies, providing extensive constraint during the interpretation process. All five independent tensors are used in the interpretation process to determine the center of mass (Txz and Tyz), edges (Tyy and Txx) and corners (Txy) of the anomaly. The expression of Tzz (the vertical component) more closely resembles conventional gravity, in that the anomaly is shown in the correct position spatially and is thus more easily related to subsurface geology. In this article, Tzz will be used to render a basic understanding of the interpretation process. Green Canyon Project The study area is located at the edge of Green Canyon and Walker Ridge, Fig. 2. The area is extensively covered by salt that affects seafloor topography. Intra-salt basins, salt canopies, suture zones and the Sigsbee Escarpment are easily discerned on water-bottom dip maps. This extensive salt covering results in poor base of salt and subsalt imaging primarily due to focusing of seismic energy by the steep salt edges. Texaco, the operator, supplied initial Top-of-Salt (TOS), Base-of-Salt (BOS), bathymetry and density grids from which an initial model was constructed.
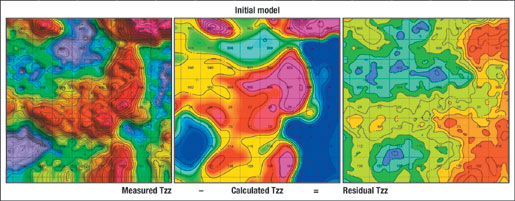
FTG modeling. Models used in the interpretation process comprised depth layers with an associated density grid. Density grids are used to allow for lateral changes in density for a more accurate model of subsurface geology. Lateral density data, provided by the operator, was used to derive seismic velocities. Seawater density (1.03 gm/cc), the basement layer (2.9 gm/cc) and salt density (2.17gm/cc) were all kept constant. The initial model, created in the company’s proprietary 3-D modeling program, comprised bathymetry and three horizons, which mimicked bathymetry structurally, as well as six additional flat horizons including basement. Tze, which is enhanced gravity, and six gravity gradients were calculated. An expected strong northwest-southeast trend in the Tze gravity map showed the overriding effect of very deep horizons and basement on gravity. However, gradients such as Tzz in Fig. 3 are able to discern features masked in the gravity data. The calculated Tzz gradient response was subtracted from measured data, creating difference maps. Note the negative 5 to 15 Eötvös (1 Eötvös = 0.1 milligal/km) anomaly in the northwestern portion of the Tzz difference map and a similar negative anomaly in the southern portion of the map. These indicate a need to decrease mass by adding salt and/or adjusting subsalt layers.
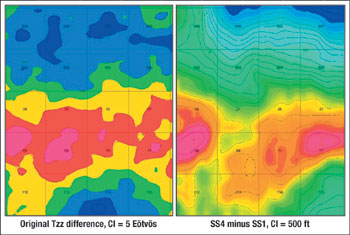
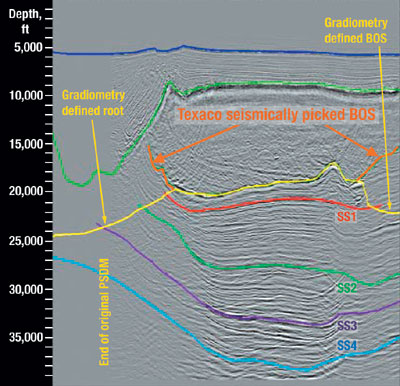
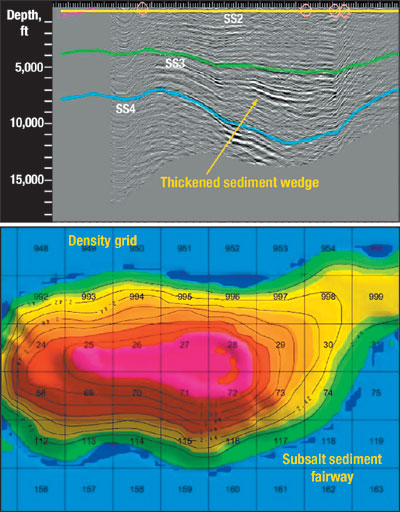
FTG interpretation. FTG interpretation is done in an iterative manner based on forward modeling. In this method, the BOS, for example, is modified based on forward-model responses of the depth-density model. The modified horizon is then exported to the seismic-interpretation platform and compared to the original seismic. The horizon is further modified based on the fit with seismic where possible. The horizon is then imported into the modeling program, and gradients of the modified model are calculated and compared to the measured data. This process is repeated until a tolerance of ± 5 Eötvös is obtained. In this manner, seismic interpretation is constrained by the gradient data, while the gradient interpretation is constrained by the seismic data. Subsalt sand fairway. Areas in which the BOS is well defined are used as calibration for density grids. If the density grids are correct and salt thickness is known, the residual between measured and calculated gradients should be zero. If a residual is present, various gradients and wavelengths of the anomaly, in combination with seismic, help determine if the anomaly is due to a feature that is above or below the salt. One anomaly within the project area was underneath a seismically well-defined salt body. A comparison of the initial-model Tzz gradient with the measured Tzz gradient resulted in a difference map that indicated a need to increase subsalt densities across the area in an east-west direction, Fig. 4. Four subsalt horizons, SS-1 to SS-4, were interpreted from the seismic, Fig. 5.
Isopachs of the SS-1 to SS-4 horizons showed a thickening of the section, corresponding to the east-west trending gradient anomaly. The section was then flattened on the SS-2 horizon. The flattened section shows a thick interval that does not correspond to present-day structure, Fig. 6. It is believed that the section represents an old sand fairway that pre-dates the salt intrusion. This sand fairway is of higher density than the shale encasing it, resulting in a positive anomaly. Density grids, representing the higher-density sand fairway, were constructed for the subsalt horizons and were used in constructing the final model.
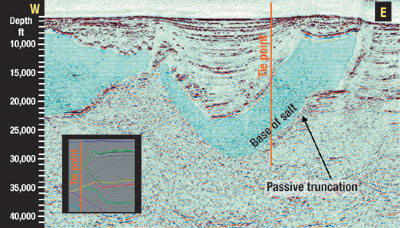
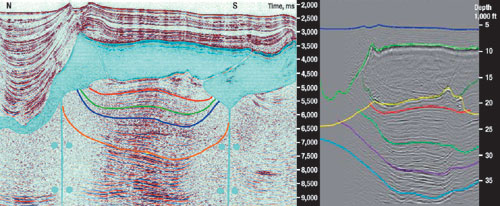
The final model. This was created by modifying the initial model where necessary, based on the gradient anomalies present. The TOS and BOS horizons used in the final model resulted from the iterative process that combined seismic and gradient data. FTG analysis indicated two deep-seated "keels" in the southern salt body and a rooted salt to the north. FTG data also detected a subsalt sand fairway that was subsequently confirmed by seismic data. Numerous overhangs are present in conjunction with the deep-seated salt bodies. The Tze and gradients were calculated as in previous iterations. Difference maps (measured minus calculated gradients) for the final model were created and show that all differences across the project area have been reduced to 5 Eötvös or less (e.g., the rightmost panel in Fig. 3 is all yellow). The geologic model over this area is now in agreement with the measured FTG data and the seismic data; and it more accurately depicts the base-of-salt, salt thickness and the subsalt environment. Quantification of the model. Pre-SDM of the seismic data and a recently drilled well were used to quantify the model. The final FTG model was incorporated into the pre-SDM process. The more-accurate densities were incorporated in the velocity model, as was salt thickness and the various roots and keels. The final pre-SDM, based on these criteria, confirmed the roots and keels either by reflector integrity or by passive truncations against the salt body, Fig. 7. In addition, a suture zone, corresponding to the pre-FTG BOS interpretation, is now clearly visible Fig. 8. Pre-SDM processing done with the benefit of this model resulted in fewer iterations, as well as improved base-of-salt and subsalt imaging. The pre-SDM fully supports conclusions reached by FTG analysis.
Conclusions FTG data successfully defined the BOS where it could not be resolved by seismic imaging alone. The final model, which incorporated the client’s BOS, the seismic data and more accurate, 3-D generated density grids, depicts a more accurate BOS horizon which significantly altered the subsalt interpretation. The FTG data detected and delineated a subsalt sand fairway that was subsequently confirmed by seismic data. This sand-rich fairway tended to mask a negative anomaly – which should have been present due to the salt coverage in the area – by creating a positive anomaly due to the higher densities of the massive sands located in the sand fairway. The FTG data clearly shows that some of the salt bodies within the project area are deep-seated and substantial. The data has determined that the remaining salt masses are much thinner and are most probably canopies. In addition, numerous substantial overhangs are present in conjunction with the deep-seated salt bodies. In general, the FTG interpretation helped drive the pre-SDM, resulting in fewer iterations, enhanced seismic interpretations and more-accurately modeled salt and subsalt geometries in the deepwater GOM.
|
|||||||||||||||||||||||||||||||||||||||
- Prices and governmental policies combine to stymie Canadian upstream growth (February 2024)
- U.S. producing gas wells increase despite low prices (February 2024)
- U.S. drilling: More of the same expected (February 2024)
- U.S. oil and natural gas production hits record highs (February 2024)
- Quantum computing and subsurface prediction (January 2024)
- U.S. upstream muddles along, with an eye toward 2024 (September 2023)
- Applying ultra-deep LWD resistivity technology successfully in a SAGD operation (May 2019)
- Adoption of wireless intelligent completions advances (May 2019)
- Majors double down as takeaway crunch eases (April 2019)
- What’s new in well logging and formation evaluation (April 2019)
- Qualification of a 20,000-psi subsea BOP: A collaborative approach (February 2019)
- ConocoPhillips’ Greg Leveille sees rapid trajectory of technical advancement continuing (February 2019)

