How to obtain reliable S-impedance from P-wave data
EXPLORATION & EXPLOITATIONHow to obtain reliable S-impedance from P-wave dataStandard AVO analysis can create errors and lead to false prospects. With additional effort, elastic impedance provides a method that gives a more correct result – and fewer dry holesGuillaume Cambois, CGG
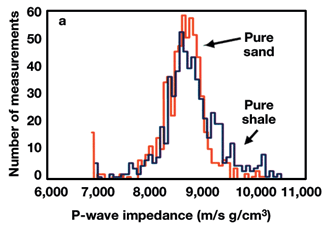
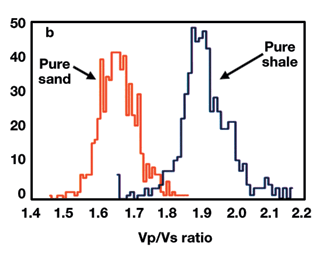
However, if the ratio of P- and S-impedance is measured, sands and shales separate into two distinct histograms Fig. 1b. In this case, S-impedance provides a hydrocarbon indicator that cannot be achieved with P-impedance. In general, the best hydrocarbon indicator is a combination of P- and S-impedance to benefit from the discriminating power of both attributes. P-impedance is obtained straightforwardly from conventional seismic data by inverting P-reflectivity. Stratigraphic inversion does essentially two things: It removes the seismic-wavelet effect and provides an "interval" measurement (as opposed to reflectivity, which is an interface measurement). There are two ways of obtaining S-impedance: either through direct measurement of shear reflectivity (using multi-component acquisition) or by AVO. The latter approach is much cheaper due to reduced acquisition costs, and it can be readily obtained from multi-offset conventional data. However, it is not a direct measurement and is, therefore, often biased by artifacts. This article reviews the best way of obtaining reliable S-impedance from P-wave data. P-Wave AVO Shuey1 showed that prestack behavior of P-wave reflection data follows the simple formula: Where: q is the angle of incidence. A and B are respectively called intercept and gradient, and are the only two terms generally considered for AVO studies. The third term becomes too small for standard data with a limited range of incidence angle. Under the approximation that the background Vp/Vs ratio equals two, A and B are related to the elastic parameters by: Where: Rp and Rs are P- and S-reflectivity, respectively, and Ip and Is are P- and S-impedance. Using these two formulas, the two-term Shuey equation can be written as: or The first expression is the small-angle approximation of Fatti’s equation.2 It expresses angle-dependent reflectivity as a function of P- and S- reflection coefficients. Using this formula, shear reflectivity can theoretically be retrieved from P-wave data. The second expression is equivalent to the formula derived by Verm and Hilterman.3 These authors called the second term on the right-hand-side Poisson’s Reflectivity (PR) because:
Castagna and Smith showed that PR is identical to Smith and Gidlow’s fluid factor when Vp/Vs equals two.4,5 The fluid factor is often regarded as the optimum hydrocarbon indicator. Fig. 2 shows two angle sections, 10° and 30°, from a North Sea 3-D data set. The AVO anomaly appears clearly and corresponds to a known gas field. A sophisticated hydrocarbon indicator is not needed to identify this reservoir. Yet, it is possible to compute intercept and gradient from these two sections:
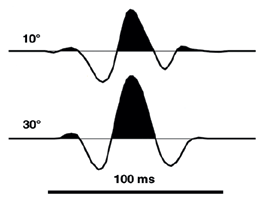
The intercept is almost equal to the 10° section, and the gradient is the difference between the two sections multiplied by more than four. When differencing seismic sections, a matching operator is usually computed to ensure that the two data sets have identical wavelets. It is odd that this is seldom done for AVO analysis. Which means that if the two sections in Fig. 2 have different wavelets, the gradient will be dominated by wavelet differences and not by the expected AVO signal. This phenomenon is called "intercept leakage," because parts of the intercept appear boosted in the gradient. Fig. 3 shows the wavelets estimated from well logs.6 Between 10° and 30°, wavelet peak amplitude increased 50%, central frequency decreased 25% and phase has rotated 45°. These effects are expected from NMO stretching. It should be obvious that these differences multiplied by 4.55 are likely to dominate genuine AVO anomalies in the gradient. In practice, more than two sections are used for intercept and gradient calculation, but this author has shown that intercept leakage occurs regardless of the number of angle sections.7
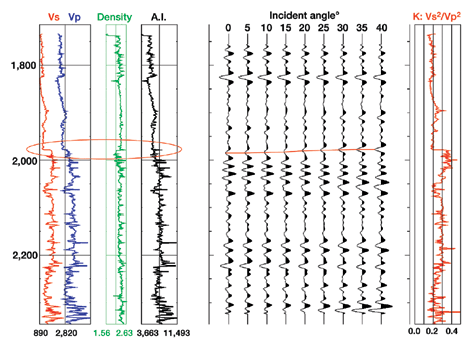
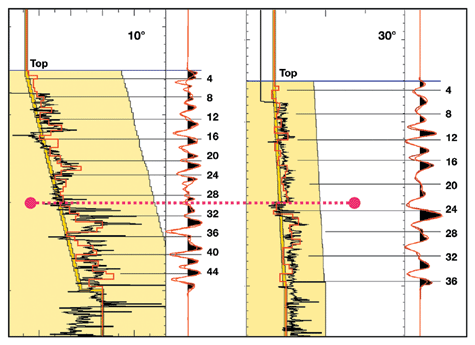
A matching filter between the two sections prior to differencing will reduce the amount of leakage and yield more-accurate results. However, the shortest bandwidth will dominate, which means that ultimate resolution of the gradient is that of the far angle section. A similar reasoning shows that resolution of shear reflectivity from P-wave data cannot go beyond resolution of the farthest angles. The difference in resolution between P- and S-reflectivity is seldom noticed in standard AVO analysis, because intercept leakage gives identical resolution to all attributes – this is, of course, artificial. After all, according to Shuey’s equation, the shear information in P-wave data is primarily located at far angles, which are most affected by NMO stretching. Wavelet variations are not the only cause of mismatch between angle sections; residual NMO-corrections also play an important part. Dense velocity analysis is therefore necessary for AVO studies. Yet, sometimes it is simply impossible to pick the correct velocity. Fig. 4 shows logs from a well that penetrated the reservoir shown in Fig. 2 and a synthetic gather. This is a typical Class 2 AVO anomaly. The top reservoir cannot be seen on small-angle reflectivity because it does not generate a P-impedance contrast (the P-velocity contrast is exactly compensated by the density contrast).
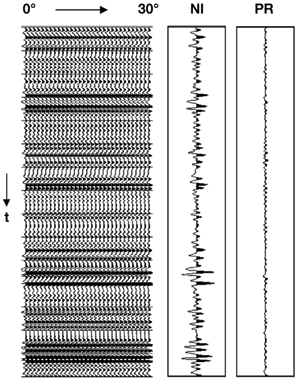
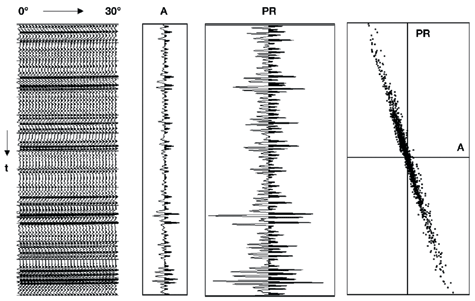
Conversely, Vp/Vs contrast is such that the top reservoir appears quite clearly at wide-incidence angles. The synthetic gather has been computed using Shuey’s equation and, therefore, has no NMO-errors. Yet, when advised to pay particular attention to the "top reservoir trough," a conscientious geophysicist will always tend to flatten it, as indicated by the red curve. Although it would be incorrect in this case (the apparent upward shift of the trough is due to waveform interference, not NMO-errors), the best data-processing geophysicists will pick a velocity that flattens the trough. There is simply no way to distinguish waveform interference from velocity variation. Unfortunately, most AVO anomalies generate offset-dependent interference. Elastic Impedance Connolly developed an alternative approach to AVO.8 Instead of first computing P and S reflectivity series from P-wave AVO and then inverting them to obtain P- and S-impedance, he proposed to first invert the angle-dependent reflectivity series – to obtain what he called "elastic impedance" for that given angle – and then compute P- and S-impedance. It can be shown that these two approaches are equivalent when all parameters are identical: same data; same wavelet; same a priori model; same expression of Shuey’s equation. However, they differ significantly when one of these parameters changes, especially the wavelet. As stated earlier, the first step of stratigraphic inversion is to remove seismic-wavelet effects. Since the wavelets are likely to be different for the various angle cubes (Fig. 3), performing stratigraphic inversion before AVO-attribute calculations can only improve the results. Hence, for this reason alone, the elastic-impedance approach is better than the standard AVO approach. There are other advantages to elastic impedance. In particular, stratigraphic inversion can de-tune seismic data to a certain extent. Hence, some of the interference effects described above can be resolved by elastic impedance. Residual NMO errors can be detected in the inverted domain and corrected before computing P- and S-impedance. However, there is a limit to the de-tuning power of stratigraphic inversion: The best algorithms can go to an eighth of the wavelength, but not beyond. Again, since the ultimate resolution is driven by the lowest bandwidth of the angle cubes, S-impedance extracted from elastic impedance will have the resolution of the widest angle. It is thus necessary for data processing to extract the maximum bandwidth out of the farthest-angle data. Data Processing Since AVO studies focus on seismic amplitudes, careful amplitude processing is essential. This involves the use of deterministic operators with the least possible data-adaptive methods. Spherical-spreading corrections based on a known velocity field are preferred to statistical amplitude balancing; deterministic wavelet shaping is preferred to predictive deconvolution; noise attenuation techniques (Radon, FX-prediction) must preserve signal. These elaborate preserved-amplitude sequences have become more refined over the years. Yet, it is sometimes doubtful whether they achieve the accuracy required for AVO analysis. Take, for example, the deceptively mundane task of prestack amplitude balancing. In the elastic theory, recorded amplitudes decay as a function of spherical divergence of the wavefront. Although compensating for this decay is easy to achieve in a simple layered-earth model, attenuation effects should never be neglected.5 Q-compensation is now routinely performed, but the resulting prestack amplitudes are never fully satisfactory. Castagna and Smith, as well as this author, have shown that inaccuracies in prestack amplitude compensation are a major factor in inflated gradient amplitudes and intercept leakage.4,6 However, analogous to wavelet variations with angle, inaccurate prestack amplitude behavior does not affect elastic impedance. The average amplitude is included in the wavelet (Fig. 3) and, as such, its influence is eliminated by stratigraphic inversion. Hence, although accurate prestack amplitude balancing – which is almost impossible to achieve – is regarded as a must in preserved-amplitude sequences, this step becomes totally irrelevant with elastic impedance. NMO also requires great care for standard AVO and elastic impedance. As described earlier, a slight mis-tie between the two angle sections generates intercept leakage in the gradient. Figs. 5 and 6 illustrate the dramatic effects of NMO-errors on AVO analysis using synthetic data. The input data is a gather of 31 angle traces sampling the 0° – 30° range at 1° intervals. The P-wave impedance model is a random series, and the S-wave impedance model is exactly its half. The prestack reflectivity series are generated using a broadband zero-phase wavelet and Shuey’s equation. At first, the gather is noise-free and the inverted intercept and Poisson’s reflectivity are exactly what is expected (PR = A + B is almost zero), which is only natural, since the same equation is used to model and invert the data, Fig. 5. Then, residual NMO-errors are introduced as a parabolic time shift that reaches 5 ms at 30°, Fig. 6. Now PR becomes a negatively scaled version of A, with a large-scale difference, as predicted by theory. The estimated PR is not just a scaled-up version of its correct value; it is heavily contaminated by intercept leakage.
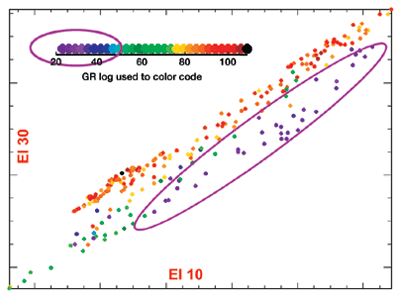
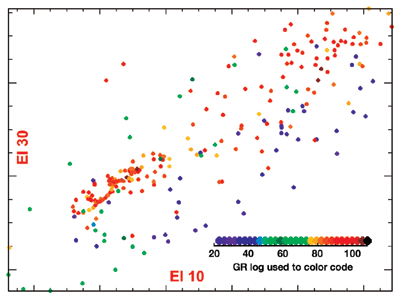
Elastic impedance is also sensitive to misalignments, albeit in a unique way. Time differences between near and far angles do not generate leakage but can still bias results. Fig. 7 shows an elastic-impedance crossplot derived from a well in West Africa. Reservoir sands are clearly identifiable. Fig. 8 shows the same crossplot after a 2-ms time shift between elastic impedance at 10° and 30°: The sands cannot be detected. The maximum "tolerable" delay before the crossplot breaks down is a function of reservoir thickness (very thin in this case).
However, this analysis should always be carried out as part of a feasibility study before venturing into any AVO project. It gives an indication of the accuracy required while performing NMO corrections. Once again, the mismatch between near and far angles is not readily observable with standard AVO. The intercept leakage generated by misalignments ensures that all AVO attributes are perfectly in phase, Fig. 6. Although the result is clearly incorrect, the artificial time match between attributes provides a deceptive sense of confidence in the data. It is, of course, much safer, although more tedious, to analyze and fix all mismatches with elastic impedance. At large offsets, seismic reflections in CDP gathers have a tendency to "curl up." This phenomenon can be due to transverse isotropy or to ray bending (the simple NMO equation assumes straight rays). Either way, a fourth-order term is needed to flatten these events and take full advantage of the wide aperture. Picking this additional term is not a trivial task and requires specific training for geophysicists and auto-pickers. The presence of anisotropy adds two major difficulties: The AVO equation changes and the incidence aperture is reduced.9,10 These two effects combine for the worse: More parameters to estimate with less independent data. If anisotropy effects are mild enough to be neglected, it is tempting to use increased aperture to estimate Shuey’s equation to three terms. However, wide-angle data brings about new problems, from acquisition (array responses and source directivity) to processing (the parabolic assumption for multiples no longer holds). There is valid data at large offsets, but extracting a meaningful third term is a lot more difficult than extracting the second term, which in itself is already a challenge. Statigraphic Inversion Many schemes transform reflection data into impedance. They use various models, constraints and inversion engines. The inversion of choice for elastic impedance is the algorithm described in Gluck et al.11 It is a 3-D, layer-based algorithm with a nonlinear (simulated annealing) inversion engine. The model is constrained by interpretation, not wells. Well logs are used for wavelet extraction and quality control, which is valid, since they are not used during the inversion process. Fig. 9 shows such QC for the data displayed in Fig. 2. Two angle cubes are inverted and results match the well-impedance quite remarkably, considering that the wells were not used in the inversion. The only constraints were the initial 3-D layer model and the impedance corridors.
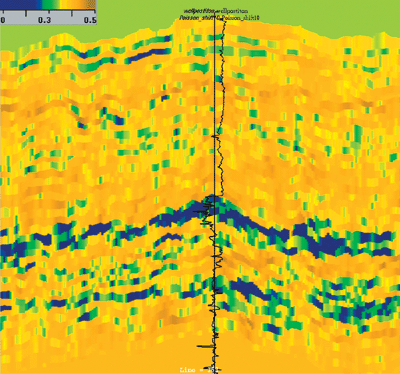
Because this inversion results in a series of layers – updated from the initial layers in time and impedance – it is straightforward to detect residual NMO-errors. This step does not compensate for widely inaccurate velocity picking (angle sections need to be similar enough to share the same initial layer structure), but it does compensate for waveform interference due to tuning. Once the layers are reconciled for various elastic-impedance angles, it is a matter of simple algebra to compute P- and S-impedance – and any other AVO attribute – from logarithmic elastic impedance. Fig. 10 shows Poisson’s ratio for the section in Fig. 2. The main reservoir is clearly visible, along with a lower structure that displays low Poisson values, but is far less visible on the original seismic data shown in Fig. 2.
Conclusion AVO anomalies exist in the real world and are a wonderful tool to detect hydrocarbons. In theory, it is possible to estimate shear reflectivity from P-wave AVO data. However, it is an indirect measurement that is prone to errors and can easily be biased. In particular, wavelet variations with offset, which always occurs, introduce artifacts that dominate genuine AVO anomalies. The processing effort required to eliminate all of these errors is sometimes overwhelming, perhaps unreachable. The elastic-impedance approach offers an elegant alternative to standard AVO. Because the prestack data is inverted before AVO-attribute calculation, the main artifact sources – namely wavelet variations and prestack amplitude balancing – are automatically eliminated. Further, a layer-based stratigraphic inversion scheme allows detection and correction of residual NMO-errors, which can efficiently compensate for tuning effects. Indeed, all AVO anomalies generate waveform interferences that make it impossible to pick accurate velocities. Because most of the shear information contained in P-wave data is located at far angles – which is the area most affected by NMO-stretching – resolution of AVO-derived shear reflectivity is necessarily lower than the expected pressure resolution. This resolution differential is seldom observed with standard AVO analysis, because intercept leakage associated with the errors guarantees identical resolution between all attributes. This is, of course, an artifact. Similarly, intercept leakage guarantees that all AVO attributes are in phase, even in the presence of residual NMO-corrections. In addition to being clearly wrong, the intercept leakage gives a false sense of confidence in the data that makes it even more dangerous. Fortunately, elastic impedance provides a way to avoid
these pitfalls. Although it is more tedious than standard AVO, because it requires stratigraphic inversion of
all angle cubes and a careful analysis of layer mismatches, the additional effort is worth it. The resulting
S-impedance is more accurate and allows detection of smaller AVO anomalies, along with correct identification
of Class 2 anomalies.
Acknowledgment The author thanks Norsk Hydro, Conoco, BP and Statoil for allowing use of their data. Literature Cited 1 Shuey, R. T., "A simplification of the Zoeppritz equations," Geophysics, Vol. 50, pp. 609 – 614, 1985. 2 Fatti, J. L., et al., "Detection of gas in sandstone reservoirs using AVO analysis: A 3-D seismic case history using the Geostack technique," Geophysics, Vol. 50, pp. 1362 – 1376, 1994. 3 Verm, R., and F. Hilterman, "Lithology color-coded seismic sections: The calibration of AVO crossplotting to rock properties," The Leading Edge, Vol. 14, pp. 847 – 853, 1995. 4 Castagna, J. P,. and S. W. Smith, "Comparison of AVO indicators: A modeling study," Geophysics, Vol. 59, pp. 1849 – 1855, 1994. 5 Smith, G. C., and P. M. Gidlow, "Weighted stacking for rock property estimation and detection of gas," Geophys. Prosp., Vol. 35, pp. 993 – 1014, 1987. 6 Cambois, G., "Can P-wave AVO be quantitative?" The Leading Edge, Vol. 19, pp. 1246 – 1251, 2000. 7 Cambois, G., "AVO attributes and noise: Pitfalls of crossplotting," SEG Expanded Abstracts, pp. 244 – 247, 1998. 8 Connolly, P., "Elastic impedance," The Leading Edge, Vol. 18, pp. 438 – 452, 1999. 9 Thomsen, L., "Weak anisotropic reflections," in Offset dependent reflectivity, Castagna and Backus, Eds., SEG, Tulsa, Oklahoma. 10 Hilterman, F., C. Van Schuyver and M. Sbar, "AVO examples of long-offset 2-D data in the Gulf of Mexico," The Leading Edge, Vol. 19, pp. 1200 – 1213, 2000. 11 Gluck, S., E. Juve and Y. Lafet, "High-resolution impedance layering through 3-D stratigraphic inversion of the poststack seismic data," The Leading Edge, Vol. 16, pp. 1309 – 1315, 1997.
|
||||||||||||||||||||||||||||||||||||||||||||||||||||||

