How 3-D and 4-D GIS technology can be applied to field development
PRODUCTION / GISHow 3-D and 4-D GIS technology can be applied to field developmentExtending 2-D GIS to the subsurface clarifies reservoir behavior, allows 4-D applications in producing fields and, ultimately, increases reserves recoveryJohn D. Grace, Earth Science Associates, Long Beach, California
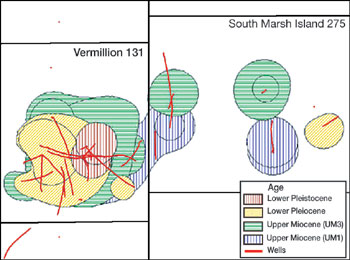
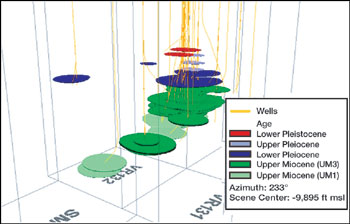
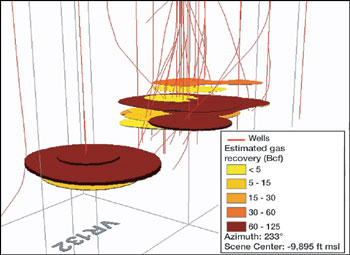
This article illustrates the use of new GIS software that works with commonly used GIS and database software for describing producing fields in 3-D and, by extension, time-lapse 3-D production (4-D). Examples are presented from Vermillion 131 and High Island 474A fields that use various GIS data types, including well logs, produced quantities, and paleontological and biostratigraphic data. Background In the late 1990s, the once-arcane technology of GIS experienced two revolutions. First, powerful GIS software moved from the mainframe to the desktop, exploiting the increasing muscle of desktop machines and leveraging their intuitive graphic interfaces. Second, GIS technology finally broke its historic 2-D surface-mapping limitation to enable subsurface description – a change critical to petroleum applications. Desktop GIS put interactive tools directly into the hands of engineers and geoscientists, replacing the system of requesting static maps from programmers working on mainframes. While a great improvement, as long as these tools stayed restricted to 2-D, GIS remained a tool primarily for exploration and regional analysis. During the last two years, Earth Science Associates began a database-centered project that resulted in GOM3, software that accommodates the transition from 2-D to 3-D GIS and its use in developing and producing oil and gas fields. This new software covers oil and gas resources of the Gulf of Mexico (GOM). It was built by customizing two off-the-shelf software packages: ESRI’s desktop GIS, ArcView and Oracle, a database manager. All the data are publicly available from the U.S. MMS (http://www.gomr.mms.gov/ homepg/ pubinfo/ piindex.html) or derived from MMS data. Because they are non-proprietary, detail can be shown that might otherwise be withheld. While this project is specific to the Gulf of Mexico, the principles of 3-D GIS technology are general and applicable anywhere. 2-D to 3-D GIS A 2-D GIS plays several roles in accessing, managing and analyzing upstream oil and gas data. It serves as a spatial front-end for databases – users get information by clicking on map features. It provides map outputs in response to queries. By comparison, a standard database query for fields with reserves greater than 20 million bbl produces a table. The same query in GIS returns a map showing the fields and a table. GIS includes the cartographic tools of 2-D mapping packages, but adds spatial analytic tools usually not found in mapping software. However, its fundamental role is as a spatial-data integrator. As more map data become available in electronic form, a central strength of GIS is to convert data in various projections and scales into common standards, thereby allowing users to merge information from multiple sources. Once data are in a consistent framework, the system may be queried for details on particular themes in a map or, more commonly, to discover spatial relationships between variables. The 2-D GIS is a potent tool. However, it encounters problems in field-development applications because variables are often stacked in depth. When multiple stacked reservoirs and their completions are flattened to 2-D, information is obscured rather than illuminated, Fig. 1. The same data in 3-D can be rotated, zoomed and panned on all axes until the information sought is clear, Fig. 2. The 2-D GIS functionality of interactively placing logical restrictions on variables (e.g., showing reservoirs and associated wells of a certain age and/or production history) is retained in 3-D, as is changing legend variables – by which features in a theme are colored or symbolized, Fig. 3. As in 2-D GIS, all features in a 3-D map can be queried onscreen for underlying information.
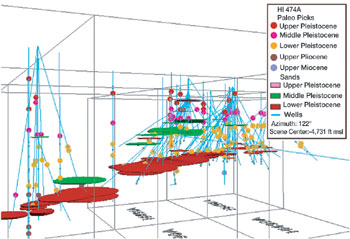
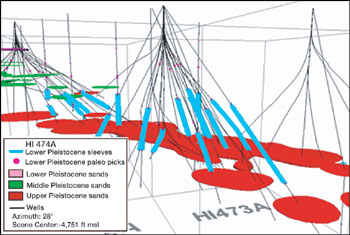
3-D GIS vs. 3-D Raster Visualization During the 1990s, seismic technology drove the development of interactive visualization of subsurface geology in 3-D. Flat seismic sections were followed by data "cubes." Adding a third dimension required new ways to see all the data that were previously out of plane in cross-sectional representations. Lithologic contacts and seismic attributes were represented by 3-D surfaces floated within the cube. A 3-D volume could be represented as the space between two related surfaces, e.g., reservoir top and bottom. Stacking depth surfaces in the 3-D volume provided a full geometric model of the sedimentary column within the original seismic-data cube. Mapping seismic attributes on 3-D surfaces forms an even richer picture, reflecting rock and gas / fluid properties. Within this environment, it was only natural to hang 3-D lines to represent wells, creating pictures of subsurface relationships that have advanced exploration and exploitation. Software developers further improved these visualization packages with 3-D tools, e.g., taking volumes. Introduction of fast desktop computers in the late 1990s (particularly Pentium III-class machines with 32 MB video cards) released the technology from the UNIX-workstation realm, spreading their use across an ever-widening user base. While these are insightful displays, most implementations of 3-D visualization growing out of seismic technology are raster representations of surfaces, lines and points. This means, in the case of a well, that the series of dots on the screen do not "know" they belong logically to the well. Therefore, a user cannot query the points along the wellbore to learn when that well was drilled or how much it produced last year. Similarly, a user could not easily recreate the 3-D scene including only wells with watercut greater than 80%. While a 3-D scene in a raster visualization package is an end result, the same 3-D scene in GIS allows further analysis of points, surfaces, lines and volumes, and identifies relationships and highlights variables that have values within specified ranges. The technologies are complementary. Development and Production Applications Two problems encountered in development geology and engineering illustrate 3-D GIS capabilities. These examples emphasize the gain created by adding the subsurface to GIS; both operate on two levels. First, they support robust visualization of 3-D relationships between subsurface variables. Second, they exploit GIS spatial-intersection functionality, automating new ways to correlate and map data. High-resolution biostratigraphy. Paleontological data span a wide scale. They contribute to defining a regional exploration framework and to detailed reservoir correlation within the bounds of a single field. A 3-D GIS depicts basic paleo data as point-symbols along the directional surveys of wells, located at sample depths, Fig. 4. Data can be identified by symbols and colors indicating specific fossils observed in samples, interpreted ages or depositional environments. The sample-point symbols on the wells can be queried for the full, associated paleontological report.
The new software uses graphical "sleeves" – a new concept – to clarify representation of a paleontologic zone in the 3-D scene. Sleeves covering the Lower Pleistocene extend along wells from the shallowest Lower Pleistocene fossil to the shallowest fossil of Upper Pliocene age. This places reservoirs and completions within their biostratigraphic context, Fig. 5.
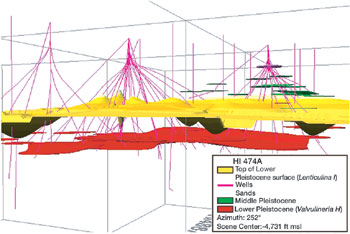
Further use of sleeves can be made by spatially intersecting them with reservoirs and completions. For example, a user first defines sleeves for a single fossil zone such as Lenticulina 1, an important marker in the upper part of the Lower Pleistocene, and then intersects those sleeves with reservoirs and completions. That way, the biostratigraphic interval "Lenticulina 1" can be assigned back to the intersected reservoirs and completions. This automates an otherwise labor-intensive process and creates new opportunities to correlate Lenticulina 1 reservoirs and group their completions for further analysis. This approach, however, only makes assignments for wells in which the marker fossil was picked. An alternative is to grid the top of the Lenticulina 1, Fig. 6. A second surface is estimated for the underlying Valvulineria "H." Those two surfaces are introduced into the 3-D scene and intersected with all wells (with or without paleo data). All reservoirs and completions between the two surfaces are assigned to Lenticulina. In common practice, estimation of the tops-surface intersection with wells lacking paleo data is routinely done to represent estimated extinction points of Lenticulina 1 – just less efficiently than in the example shown here.
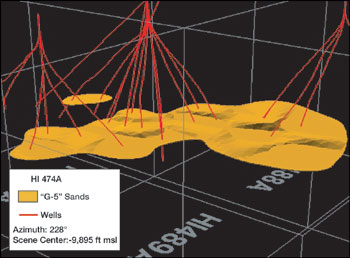
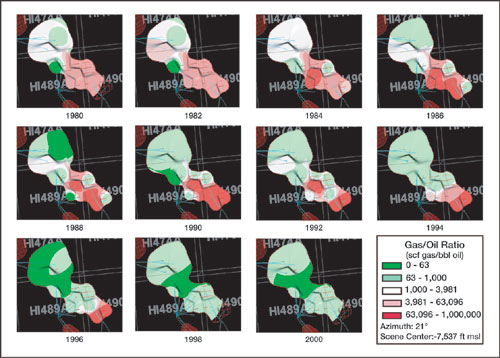
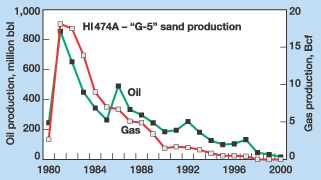
Well log data in 3-D GIS. Because there are many excellent log-analysis packages, logs are not imported into 3-D GIS until analysis is complete. Log curves are then brought into a 3-D scene to put other data in context and show rock and pore-fluid properties. For visualization, logs provide detailed context of stratigraphy, rock and fluid / gas properties within and surrounding the reservoir. As in the paleo example above, with some manipulation, log data can also be used to characterize completed intervals and reservoirs. For example, take a set of interpreted logs with porosity calculated for each well that penetrates a reservoir. Then intersect the reservoir’s completions with calculated average porosity from log data to determine average interval porosity throughout the reservoir and in each well. Porosity can then be gridded over the reservoir and a porosity map draped atop a 3-D polygon representing the reservoir. The same method applies to other log parameters, including calculated water, hydrocarbon saturation, net-to-gross pay and average net thickness within a gross interval. At higher resolution, it is possible to create a pseudo-tomographic picture of porosity distribution within the reservoir or of other log-derived parameters. To accomplish this, porosity is averaged from log data over every 10-ft (or other constant) interval. The average porosity estimate for each 10-ft vertical slice is then gridded across the reservoir, creating a succession of porosity maps. These stacked-slice maps can be animated and rotated in 3-D for visualization of intra-well porosity (or other variable) distribution. The grids can also form the basis for inputs to reservoir simulation. This is a typical advantage that GIS integration brings to problems. GIS does not do well log analysis but, based on spatial criteria, extracts results of those analyses and combines them with other data; this forms the basis for new mapping or more study. Incorporating geostatistical tools into the newest version of ArcView will allow greater extension of this capability as well as uncertainty analysis in reservoir parameter mapping. 4-D Reservoir GIS Part of the advantage of GIS for 3-D visualization is its direct access to underlying attribute data for subsurface elements such as reservoirs, wells and completions. This access enables easy mapping and remapping of different variables and inspection of the results in a 3-D environment. The ability to quickly remap is especially useful in analyzing production and test data from a reservoir over time. For example, consider the gas-condensate reservoir in Fig. 7. Within the GIS, annual observations on gas and liquids production for each completion are gridded and mapped as gas-oil ratio (GOR). Maps for each year are then draped in succession on top of the 3-D reservoir, creating an animation of the 20-year (1980 – 2000) variation in GOR within the reservoir, Fig. 8. The maps clearly draw attention to performance differences across the reservoir that cannot be seen by simply plotting oil and gas production over time, Fig. 9.
Because reservoir thickness and structure are already reflected in the geometry of the 3-D polygon representing the reservoir, draping the animation on it puts the annual production maps in a useful context. Changes in production rate, watercut, GOR and pressures are displayed against reservoir geometry and fault intersections. Simply watching the animation provides insights into reservoir compartmentalization, potential locations for infill drilling, water breakthrough and the impact of recompletions and well treatments. This type of analysis focuses on changes in variables (e.g., flowrates, pressures, watercuts) as a function of both time and 3-D space – hence, 4-D GIS. The 4-D examination of production and pressure data can be enhanced by the choice of gridding algorithms. Most geologic data are gridded and mapped using algorithms that simply model the value of a variable at each point in the grid as a general function of its distance from control points. An alternative is to model the value at each point using a function based on the physics of the underlying process being mapped – here, the movement of fluids and gases through rock. Such an approach, borrowing directly from reservoir engineering, is to grid production using the radial flow equation, which describes fluid movement in response to pressure changes. This provides more analytically robust production maps in each time-step. The grids themselves can be further manipulated to indicate reservoir compartmentization, changes in relative permeability, liquid / gas viscosity and insights into completion efficiency or waterflood performance. What Lies Ahead Further improvement of 3-D GIS tools for exploration and development projects fall into three categories:
Since 3-D GIS is in its infancy, the current system capabilities offer only a glimpse of a technology that will increasingly impact field-development analysis. The power of 3-D GIS derives not from number-crunching ability, such as inverting enormous matrices in seismic processing; rather, it extends what minds and eyes do best – seeing spatial relationships. GIS, especially 3-D, will be essential for converting the industry’s vast investments in electronic data into economic value.
|
||||||||||||||||||||||||||||||||||
- Prices and governmental policies combine to stymie Canadian upstream growth (February 2024)
- U.S. producing gas wells increase despite low prices (February 2024)
- U.S. drilling: More of the same expected (February 2024)
- U.S. oil and natural gas production hits record highs (February 2024)
- Quantum computing and subsurface prediction (January 2024)
- U.S. upstream muddles along, with an eye toward 2024 (September 2023)

