Dynamic swab-surge model: Validation/ field examples
DRILLINGDynamic swab-surge model: Validation / field examplesImproved software model predicts downhole pressures in close agreement with pressure-while-drilling readingsG. Robello Samuel and Glenn McColpin, Landmark Graphics; and Peter Bern, BP
The following discussion summarizes the need for such data and the background of the new model’s development. Case histories, using information from BP’s field operations present comparative curves of measured and predicted pressures in three example situations: 1) swabbing with circulation; 2) reciprocating without circulation; and 3) surge without circulation. Introduction Qualitative assessment and quantitative characterization of well pressures are valuable information to have available during various phases of well construction. They not only allow for subsequent adjustments of the well plan when combined with payzone geo-steering tools, but also for successful completion of extended-reach and complex wells. Increasingly, these more difficult wells are being drilled in deep- and ultra-deep waters with a narrow margin between pore and fracture pressures. This requires that swab / surge pressures be maintained within narrow limits while tripping drill pipe, running casing, and in cementing operations. Operating outside this safe operating window for even short durations has historically led to costly well complications. Monitoring the actual downhole pressure in real time with a pressure-while-drilling (PWD) tool is a reliable method; however, real-time data is generally confined to periods of continuous circulation. In addition, it is not possible to run conventional PWD tools inside casing strings. If a reliable predictive model validated with the real-time data is available, it will help accurately evaluate transient wellbore pressures at an early stage during the well-planning phase. Validation also offers a viable tool to provide accurate data, not only in the planning phase, but also to better define operating limits for both drilling and casing operations. Developing confidence in computational predictions requires a rigorous procedure to verify that trends and magnitudes of the results match reality. Model Development Pressure surges in critical complex wells are commonly determined using steady-flow surge models. The first, fully dynamic, surge-pressure model was developed by Lubinski.1 Lal corrected a number of deficiencies in the Lubinski model and presented the influence of various parameters affecting surge pressures.2 Subsequently, Mitchell added the pipe axial elasticity effect to dynamic-surge analysis.3,4 The Mitchell model is used in Landmark’s WELLPLAN engineering software suite, which was utilized to verify the following case studies. To enable the case study work, BP provided PWD data from a number of Alaska and North Sea wells, with a range of hole diameters and different base-fluid muds. The data was compared and interpreted with the dynamic-surge model, which includes fluid inertia and compressibility, wellbore elasticity, pipe axial elasticity, and temperature-dependent fluid properties. The PWD sampling rate was specifically increased to two seconds and, in some cases, one second. This prevented downhole data attenuations and helped capture the full wave forms more accurately. Simulation indicated that this rate was sufficiently fast to adequately characterize any transient response. Different operations were included in the PWD runs to cover swabbing, surging, reciprocation and simultaneous pumping operations during tripping. Model predictions of downhole pressure behavior were in excellent agreement with measured PWD data. Example 1: Swab With Circulation After drilling the 9-7/8-in. hole section, the string was pulled out of the hole for the 7-5/8-in. casing job. The string comprised these downhole tools: jar, stabilizers, PWD tool, positive displacement motor and tricone bit. Distance to the PWD sensor from the bit was 43 ft, and mud properties at the time of pulling were:
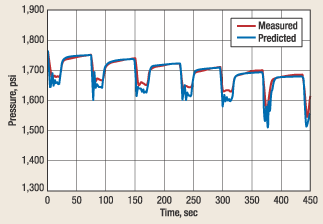
The string was pulled in singles with circulation. PWD data from 3,712 ft to 3,520 ft was used in the analysis. To account for pipe breaking / making time while pulling the six singles used in this analysis, a velocity profile was used in the simulation for accurate prediction. Fig. 1 compares measured and predicted results. As shown, predicted results correlate quite well with measured data. In this particular case study, mud weight was tuned to match the starting, non-uniform hydrostatic gradient. It can be seen that the peak pressure measured is slightly higher than predicted response pressure of PWD data. The data adjustment is justified, as settling might have occurred in the mud column, which would result in a non-uniform hydrostatic gradient.
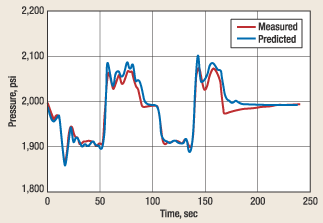
Example 2: Reciprocation Without Circulation During pipe pull-out, tight spots were encountered. After clearing these, reciprocation was carried out at a depth of 4,250 ft without circulation. The pipe was reciprocated between 4,250 ft and 4,180 ft, with variable stroke length, to confirm that the tight spot had been cleared. This operation and data set provide a case for simulating reciprocation when not circulating. In this case, due to variable stroke length / rate, a velocity profile was used for the simulation. Mud properties at the time of reciprocation were the same as those in Example 1. Swab and surge pressures during reciprocation predicted by the model compared well with the PWD data, Fig. 2. The peaks and troughs correlated well with wave oscillation in time. Both frequency response and predicted waveform amplitude matched measured PWD data closely. Near the end of the pressure waveform, smoothing of the peaks is observed, and the pressure predictions are within 2%.
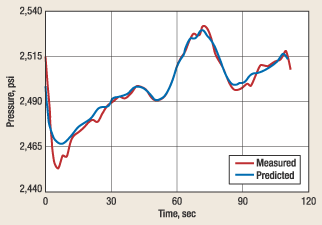
Example 3: Swab-Surge; Summary The third case is an example of a surge operation in a well at a depth from 5,217 to 5,285 ft. The predicted surge-pressure waveform is in close agreement with measured data. The predicted curve exhibits the same transient behavior as that of the measured data, but with smaller amplitude at the start; and it matches perfectly in the latter part of the waveform. The transient peaks are strictly a dynamic phenomenon that would not be predicted by a steady-state model.
In summary: 1) this study reinforces existence of several non-intuitive transient effects, such as the observation of surge effects while swabbing and vice versa; 2) in addition, the data clearly shows dynamic and inertial effects not anticipated by conventional practices but predicted by the model – unexpected transient effects observed also aid in demonstrating that a steady state analysis may not always be conservative; 3) the minor deviation in predicted values may be attributed in part to non-uniformity of the wellbore and failure to account for the elastic response of surface equipment; and 4) based on excellent agreement between model and measured data, the model accurately portrays swab / surge pressures throughout the wellbore. Literature Cited 1 Lubinski, A., F.H. Hsu and K.G. Nolte, "Transient pressure surges due to pipe movement in an oil well," Revue de L’Institut Francais Du Petrole, May – June 1977. 2 Lal, M., "Surge and swab modeling for dynamic pressures and safe trip velocities," Proceedings, 1983 IADC / SPE Drilling Conference, New Orleans, Louisiana. 3 Mitchell, R.F., "Dynamic surge / swab pressure predictions," SPE Drilling Engineering, September 1988.
|
||||||||||||||||||||
- Coiled tubing drilling’s role in the energy transition (March 2024)
- Using data to create new completion efficiencies (February 2024)
- Digital tool kit enhances real-time decision-making to improve drilling efficiency and performance (February 2024)
- E&P outside the U.S. maintains a disciplined pace (February 2024)
- Prices and governmental policies combine to stymie Canadian upstream growth (February 2024)
- U.S. operators reduce activity as crude prices plunge (February 2024)
- Applying ultra-deep LWD resistivity technology successfully in a SAGD operation (May 2019)
- Adoption of wireless intelligent completions advances (May 2019)
- Majors double down as takeaway crunch eases (April 2019)
- What’s new in well logging and formation evaluation (April 2019)
- Qualification of a 20,000-psi subsea BOP: A collaborative approach (February 2019)
- ConocoPhillips’ Greg Leveille sees rapid trajectory of technical advancement continuing (February 2019)


