Effects of pore geometry on oil and gas recovery
Effects of pore geometry on oil and gas recoveryDescriptions of how gases and liquids move, or don’t move through reservoir porosity and how this affects the efficiencies of reservoir drive mechanismsSantiago Rivas-Gomez, Consultant, Mexican Petroleum Institute
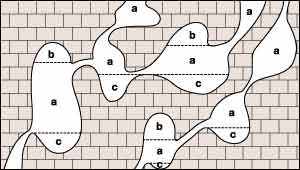
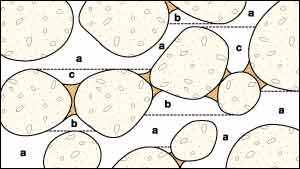
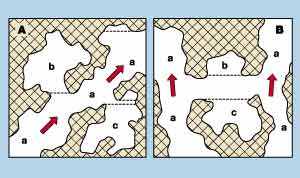
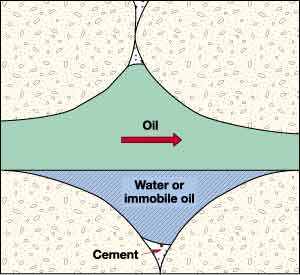
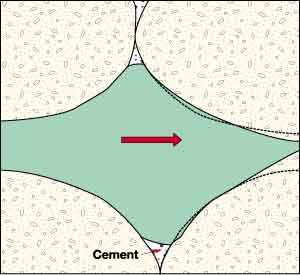
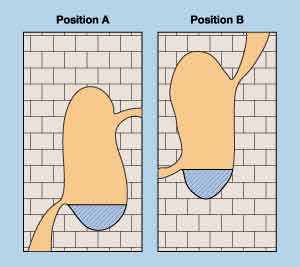
Discussion centers on porous model studies, that generate several important implications for recovery mechanisms, such as the higher performance of gravity segregation type drives. And core handling techniques are reviewed, emphasizing the importance of proper orientation to match that found within the actual reservoir. Initial experiments with the porous model are introduced, leading to a recommendation for further work. Introduction Based on experimental results to determine residual gas saturation (Sgr), it can be stated that hysteresis presented in the capillary pressure curves obtained for both drainage and imbibition mechanisms is, in water-wet rocks, mainly due to the pore geometry. It is also obvious that the process to obtain those curves for water and gas gives irreducible water saturation, as well as residual gas saturation. The behavior that gas and water should show is also analyzed in accordance with the stated porous pattern, thus explaining some effects presented during the primary exploitation and – as a result derived from that pattern – the possibility to apply secondary recovery through gas injection to oil reservoirs with an active water drive in the advanced exploitation stage – as are those of the older Gold Lane in Mexico, which have, in 95 years of exploitation, produced more than 1 billion bbl oil. Experiments by Geffen et al.1 and Chierici et al.,2 on residual gas saturation in cores swept by water, showed that its value is of the same order as that of the oil’s residual saturation in light-oil reservoirs. Both authors found, too, that pressure and temperature have no influence on residual gas saturation. The experiments were developed from atmospheric to 5,000-psi pressure, and they studied temperature effects to 80 and 250°F. This wide range of parameters led to the need for an explanation of why pressure and temperature variance does not modify the Sgr. Such an explanation was located in the shape shown by some pores of the limestone reservoir rock of the Akal field (a major offshore oil producer in Mexico) which led to a study of that pore model, similar to that proposed by Perez-Rosales.3 Porous Model A proposed explanation of the fact that pressure and temperature do not affect the gas residual saturation is presented here. There are traps in the rocks from which gas cannot escape vertically, and the displacing fluid cannot break through, due to its higher density – as shown in Figs. 1, 2 and 3 A and B, which are porous patterns illustrating experimental results from Geffen and Chierici.1,2 In those spaces, trapped gas will show constant volume, thus the Sgr must be constant – independent from the pressure and temperature at which the determination is developed.
In Figs. 1 – 3, the gas traps have been identified as "b"; the regions where gas and water flow freely are "a"; and zones from which water, through gravity, will bring out gas – in case this fluid occupies that space – are denoted "c". It is estimated that this same process will act on the oil in water-wet rocks, as is mentioned by Chierici in reference to the same Sgr values for gas and light-oil reservoirs. Due to the oil reservoir accumulation generation, in which the rocks were initially water flooded, the oil migration left water trapped in the lower spaces of each pore, constituting an important part of the water saturation, along with that due to capillary pressure and molecular forces. Use of this pattern to explain Geffen / Chierici’s results led to review of the process to determine, in the lab, the gas residual saturation and the capillary pressure. Capillary Pressure Curve Hysteresis Results of the analysis noted previously brought out an explanation of the hysteresis as presented in the drainage and imbibition capillary pressure curves. In the drainage process, when applying pressure to the 100%-water-saturated sample (Fig. 4A) and to displace water by gas (Fig. 4B) the connate water saturation is obtained, formed by a water molecular layer stuck to the porous walls and the water trapped in spaces "c."
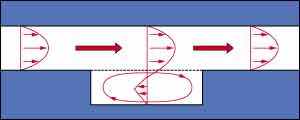
When applying the process by imbibition, gas is displaced by water, but water cannot dislodge the gas contained in traps "b," (the volume of which will constitute the Sgr) thus preventing the capillary pressure curve from reaching Sw = 100%, as indicated in Fig. 4C. Rose4 studied a model with one trap, or "cul de sac," in which he demonstrated that, for laminar flow, fluid inside the trap is not extracted – it only performs a swirl movement as an effect of the displacing phase, Fig. 5.
Implications / Applications For Recoveries Pore internal geometry intervenes on gas production behavior in undersaturated oil reservoirs, because an important portion of the gas released, as soon as reservoir pressure is less than bubble pressure, is accumulated in the upper pore part, in addition to the gas bubbles that cannot go though the small pore throats,5 Fig. 6 A. These two combined effects cause gas production to go down over time; and it is observed that gas-oil ratio diminishes, to be later increased when gas saturation reaches equilibrium (Fig. 6 B at about 170 MSTB), or when the falling pressure lets the gas bubbles be deformed and go through the small throats.
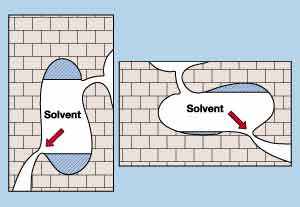
High recoveries present in some oil reservoirs due to gravitational segregation can be explained with this pore model. If vertical permeability is high, this mechanism allows high oil recoveries, as it does not permit trapping the oil in the upper part of the pores. This case requires exploitation through wells completed in the lower part of the reservoir. If the Sgr is small, it means the upper part of the pore volume is small, and recovery due to bottom water injection will have the same effectiveness as that of gravitational segregation – with the advantage of handling a greater pressure in a more economical way. This statement makes it necessary to evaluate the Sgr with the core in the same position it had in the reservoir, to define the best secondary recovery process to be applied. This stresses the importance of knowing the exact direction in which core analyses are carried out in reference to the reservoir. Another consideration concerns washing the core for analysis, which will be quicker and more efficient if the cores are rolled to several positions to avoid oil trapping, Fig. 7.
The denser fluid in a trap does not move from the pore space during the displacement, Fig. 8. It does help explain how the same absolute permeability value, or oil relative permeability equal to one, is obtained for water saturation values between zero and connate water saturation.
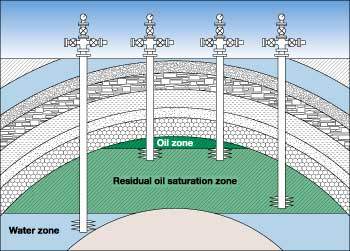
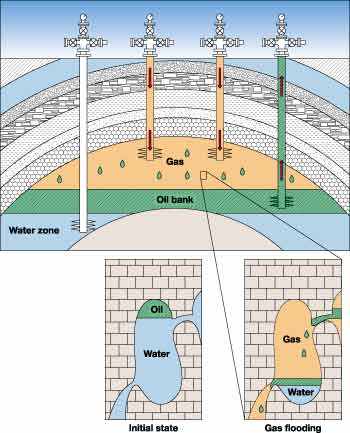
For older oil reservoirs which have water drive, the analysis here stated can give a procedure to increase their recovery, since it is probable that they keep the conditions shown in Fig. 9, i.e., their oil is swept by the natural water influx and produced by the highest structural wells; and then the reservoir is abandoned or near to be abandoned. Such reservoirs retain most of their residual oil, located in upper parts of the pores, unable to escape. In this case, gas could be injected in the upper part of the reservoir to create a gas cap from which the oil will drain to the water zone, forming an oil bank that is possible to exploit, Fig. 10.
Another explanation coming from the porous model is related to pore-permeability graphs and correlations, which show very different permeabilities for the same porosity value. In Fig. 11, it is observed that the effectiveness of different pores having the same porosity can be very different regarding fluid movement – i.e., they display very different permeabilities, making it difficult to find a good relation between porosity and permeability – with the exception of some very clean sedimentary rocks. In most Mexican reservoirs, it is difficult to find good correlations; in almost all the permeability-porosity graphs, permeabilty variations from 1 to 100 md can be obtained for the same porosity values.
Experimental Work To verify the proposed porous model behavior, an experiment was designed to get the capillary pressure curve in the same core, both by drainage and imbibition in two opposite directions, by changing position 180°, Fig. 12. In this case, should the proposed hypothesis be verified, the Swi and the Sgr must be interchanged.
The experiment was carried out in a Berea sandstone sample with 200-md permeability. Data obtained to date are: 1) Test I: Swi = 59% and Sgr = 16%, and 2) Test II: Swi = 32% and Sgr = 42%. The experiment was not conclusive; instead of the Swi = 16% in Test II, 32% was obtained. But the experiment was not completed, it could be possible to reach lower values such as the 16% mentioned. Regarding the Swi from Test I corresponding to the Sgr of Test II, 42% was obtained. It is important to stress the large difference between the curves obtained in
the two cases studies. This is an important incentive to continue with the investigation described here. This
concept undoubtedly requires a further work.
Literature Cited
The author
|