September 1999
Supplement
99-09_ptd_waterflood-reynolds_fig2.htm (Sep-1999)
A monthly magazine offering industry news, statistics and technical editorial to the oil and gas drilling, exploration and production industry.
 |
|
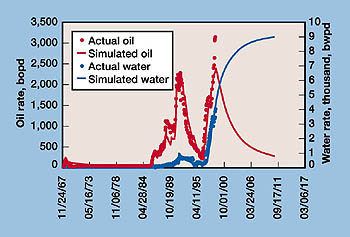
Fig. 2. In this revised history match for the field, data points represent actual production and lines indicate simulated values. The three production peaks are due to field-wide development, a hydraulic fracturing program and the waterflood, respectively. |
|
|
Copyright © 1999 World Oil
Copyright © 1999 Gulf Publishing Company

