What's new in geophysics/ geology
GEOPHYSICAL / GEOLOGICAL REPORTWhat’s new in geophysics / geologyFour reports on new and emerging technologies that help the E&P industry discover and manage oil and gas reservoirs.Perry A. Fischer, Engineering Editor
Oil and water: Can you follow water to its source rock?Organic acids — including acetic acid, commonly known as vinegar — are routinely found in water that is pumped from underground oil reservoirs. Exactly how these acids relate to the generation of petroleum is not altogether clear; but oil companies have long suspected that if the acids were properly analyzed, they could yield useful clues about the petroleum "systems" from which they are drawn. "These acids are hard to get at analytically," says Robert Dias, a doctoral student in geochemistry at Penn State. "They typically exist in very low concentrations, and they’re chemically volatile. Extracting them from water can alter them." Finding a way over this hurdle is one of the reasons Dias left a job in the oil industry to come to graduate school and work with Penn State geoscientist Katherine Freeman. One of Freeman’s specialties is analyzing organic matter according to the isotopic composition of its carbons. Background. Carbon has two stable isotopes in nature, Dias explains, 12C and 13C. Although the two are identical, chemically speaking, at the subatomic level they are slightly different. "Carbon 13 has one extra neutron. The isotopic composition of the carbon in a substance," Dias continues, "specifically, the ratio of 13C to 12C it contains can be an important key to how that material was formed. Biological, chemical, and physical processes will all separate carbon isotopes," he says. In the case of evaporation, for example, "under normal conditions, the lighter isotope, carbon 12, typically goes off first." In his first year with Freeman, Dias worked on developing a technique for pinpointing the 13:12 ratio in organic acids dissolved in water. The simplest and best approach, they found, is one called solid-phase micro-extraction. Dias picks up an instrument that looks like a syringe. The glass-fiber needle on its end, he explains, can be coated with different organic phases — thin layers of solid material intended to adsorb, or grab hold of, specific molecules in solution. "For this purpose," he says, "we use a phase that is attractive to organic acids." The syringe is dipped into a glass vial containing a sample of oil-related water and left there until the water’s organic components latch on. The needle is then retracted and inserted into a gas chromatograph, where it is heated until the organic components clinging to its surface desorb into a stream of carrier gas. This gaseous mixture then flows into a spiral chromatographic column where its components are separated out according to their different masses and chemical properties. "What we end up with," Dias says, "is a well-resolved spectrum of compounds. From that we can get the carbon isotope ratio." Arco’s research. Dr. Stephen Franks, a senior research advisor with Atlantic Richfield Co.’s research center in Plano, Texas, was also looking at organic acids, but from a different angle. He had postulated that the carbon isotopes of organic acids might carry the "fingerprint" of the source rock from which petroleum is generated. If so, he proposed, then the acids could be used to trace the origin of petroleum and identify different petroleum systems in basins from water alone — without having a direct sample of the petroleum itself. This could potentially be an important tool in petroleum exploration. However, ARCO’s technique for measuring the isotopic composition of the acids was not working well. To test this hypothesis, Franks needed someone who could accurately measure the carbon isotopes of the acids without altering them, so he contacted Dr. Freeman. Due to her expertise in compound-specific carbon isotope analysis, Arco entered into a contract with her to make the measurements. Franks had already sampled waters and oils from a basin to test his hypothesis. That basin contained two source rocks, each generating a slightly different type of petroleum. The waters were sent to Freeman and Dias and the oils were analyzed by ARCO. "Because no one had ever measured the carbon isotopes of organic acids from oilfield waters, we expected possible surprises," said Franks. "However, the magnitude of the carbon isotope variations in the waters was astounding! They exceeded the total variation seen in oils worldwide!" Worse yet, the isotopic composition of the two groups of waters co-produced with the two families of oils showed almost complete overlap. At this point, the project seemed a failure. However, the large variation in values turned out to be an important clue. Organic acids contain two general types of carbon bonds within an acid molecule — those bonded to other carbons and hydrogen (alkyl carbons) and those bonded to other carbons and oxygen (carboxyl carbons). The former is more "hydrocarbon like." "It struck me," said Franks, "that perhaps the two types of carbon had different isotopic compositions, and that the carboxyl carbon was giving an extraneous isotopic signal within the molecule. Perhaps the actual hydrocarbon fingerprint resided in the alkyl carbons." If so, there should be a systematic relationship between the number of these carbon types and the isotopic composition of the molecule. This would allow one to calculate the isotopic composition of the hydrocarbon-like alkyl carbons separately from that of the carboxyl carbon in the acid. "When I first started plotting the results on my computer, I could hardly believe it," said Franks. "I had never seen data behave so beautifully." It turned out that the carbon isotopic composition of alkyl carbons within the acids (from waters in each oil group) perfectly matched the isotopic composition of the co-produced oils. "The fingerprint was definitely there, it was just smeared a bit," he said. For Dias, a doctoral dissertation was born — an attempt to simulate experimentally what had been observed in the natural samples. Creating oil. Dias contacted Mike Lewan, a colleague at the United States Geological Survey in Denver, Colorado, who has an experimental set-up for simulating the generation of oil. Lewan can recreate the millennia-long, oil-making process on a Lilliputian scale, in 72 hours. "He seals up immature source rock and water in a reactor drum, heats it to 200 or 300°C and leaves it over a weekend," Dias says. Temperature takes the place of time, and on Monday morning, Lewan ends up with a layer of spent source rock, a layer of water with organic acids in it and, atop that, a layer of oil. Dias analyzed samples of the water produced by six different types of source rock in Lewan’s reactor and got six very different carbon-isotope values. "This gave us some idea of the range of values that might be found in nature," he says. He also found that, for any one source rock, there were large swings in the 13C:12C ratio depending on the temperature to which the reactor had been heated and the molecular weight of the organic acid. He knew then that he was onto something valuable. Conclusion. "This gives an internal molecular marker to tell how a compound was generated, what it reacted with and how it was destroyed," Dias explained. In other words, by means of a simple test, a geoscientist can discern what type of source rock and what types of geologic processes produced the oil-related acids in a given water sample. "This is potentially a very important tool for oil exploration and reservoir development," he says. "It can give explorationists a better idea of the nature of the petroleum system they’re dealing with without having to have a sample of oil." Acknowledgment
A wealth of geophysical data is available from government sourcesMany U.S. and international governmental organizations research and gather geological and geophysical data, some of which may be of use in oil and gas exploration. In fact, there are so many that this page could easily be filled with just their addresses. A small sampling is presented herein, but interested parties should begin by perusing these website labyrinths and their associated links. A good place to start is: www.ngdc.noaa.gov/mgg. Topographic / bathymetric relief. The National Geophysical Data Center (NGDC) is addressing the need for topographic / bathymetric relief models that integrate land and seafloor elevations. This is being accomplished by assembling a database that merges U.S. Geological Survey 3-arc-second digital elevation models with a vast compilation of hydrographic soundings collected by the National Ocean Service and various academic institutions. The principal component of the database is 3-arc-second elevation grids, of areas 1° in longitude by 1° in latitude, in which elevations are resolved to 1/10 m. The database also includes grids containing the number of soundings enclosed by each cell in the offshore areas of the elevation grids and images of both the elevation and sounding density grids, Fig. 1. The images are in common graphic formats that can be displayed by a range of UNIX-based and personal computer software. They are available on CD-ROM with an HTML interface that allows the images of the grids to be searched for and retrieved using any common web browser. Marine Trackline Geophysics. The latest "Marine Trackline Geophysics, Ver. 4.0" contains all of NGDC’s digital, marine geophysical trackline data, including new data that has been acquired and assimilated by NGDC from January 1997, through October 1998. The new data covers 1.1 million km of bathymetry, magnetic and gravity from 158 surveys (Fig. 2) and includes over 2.4 million additional digital records.
NGDC’s GEODAS (GEOphysical DAta System) Marine Trackline Geophysics database contains bathymetric (including multibeam bathymetry), magnetic, gravity and seismic navigation data collected during marine cruises from 1953 to the present. Coverage is worldwide. This database, including all of NGDC’s digital holdings, can be obtained from (NGDC’s) Marine Geology and Geophysics Division. Data is distributed as CD-ROM sets complete with the GEODAS search and retrieval software for Windows 95/98/NT and UNIX XWindows. Searches by geographic area, year of cruise, institution, platform, cruise, date or data type are available. Additional information and updates are available via anonymous FTP (ftp.ngdc.noaa.gov) and gopher. Data sources include both U.S. and foreign oceanographic institutions and government agencies. Geophysical data from the Deep Sea Drilling Project (DSDP) and the Ocean Drilling Program (ODP) are available on both the GEODAS Marine Trackline CD-ROM data set and the DSDP and ODP CD-ROM data sets. The data includes documentation headers and file specs for all surveys. NGDC also archives analog geophysical data, including seismic reflection and refraction, side-scan sonar and other data types. Analog underway geophysical data is inventoried and searchable through this same GEODAS system for marine Trackline Data. NGDC is building its global marine databases to better serve as the international focal point for marine geological and geophysical data management. NGDC is pleased to accept contributions of underway geophysical data on almost any media, preferably in the MGD77 format. A format of the contributor’s choice is also acceptable if it is well documented. Any data received is in the international public domain, readily available globally to any interested individual or group. For information, contact Robin Warnken, warnken@ngdc.noaa.gov, 303/497-6338, fax 303/497-6513. Technical data contact: Dan Metzger, dmetzger@ngdc.noaa.gov, 303/497-6542. IOC and JOIDES. Stop by the Intergovernmental Oceanographic Commission (IOC) site at http://ioc.unesco.org. It conducts programs to serve as a guide for the rational management of potentially valuable non-living resources of the world’s oceans, including oil and gas deposits. If you are looking for something new in scientific ocean drilling, stop by
www.joides.geomar.de. There you will find a wealth of new information on marine geology and
geophysics. Also stop by a related site, joi-odp.org. Of particular interest is the gas
hydrate update section in its JOI/USSAC newsletter. What’s new in marine seismicThe seismic industry experienced a large capacity buildup the past year. Although seismic has not suffered as much as, say, drilling — owing to its long-term goals and the fact that it is viewed as a value-added business, often compared to the cost of a single dry hole — this extra capacity comes at a time when E&P budgets are being cut. With only a handful of acquisition equipment manufacturers supplying the industry, seismic data is becoming increasingly commoditized. Competition has never been tighter, and costs have never been more important.
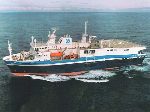
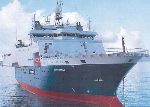
In a question and answer format, World Oil asks four of the leading seismic contractors to discuss their ideas about data acquisition today and what areas they are focusing on for the future. Seismic companies build their vessels in a variety of differing shapes and sizes. Perhaps these represent trade-offs such as towing capacity or fuel economy vs. stability. What were your reasons for choosing your latest hull design(s)? CGG’s Alizé and the Geco Eagle are the only two vessels that we believe were purposely designed around a seismic deck. CGG stayed with a conventional hull because we believe it is more stable and quieter, since a wider hull requires the continuous use of thrusters, which is a noisy solution. We worked closely with naval architects to reduce noise levels, as this is very important in military applications. Geco-Prakla’s philosophy is that the quality and geometry of the in-sea equipment a vessel can store and deploy should be the focus. We believe the 37-m-wide back deck on Geco Eagle, combined with her conventional hull, does not lead to a trade-off in capacity. She can store and deploy more recording equipment than any other vessel in our fleet — and perhaps more than any vessel afloat. Our design team in Oslo avoided all preconceptions when looking at hull design. Multi-hull (catamaran, trimaran) and wide hull options were all considered, but the proven advantages of a trawler-shaped hull, tried and tested over many years, were very clear to us. Our concerns about using a wide hull included:
Veritas builds its vessels using a conventional hull form. The logic of using an unconventional wide-stern / narrow-bow configuration is that it could give more back-deck deployment space, more buoyancy at the part of the vessel that has to carry the streamer load, and more stability. Our feeling is that with careful design based on a conventional hull you can achieve all of the above, without having to make the operational compromises that these odd hull shapes bring. Some of these compromises include limited access to harbors, drydocks and the restricted number of shipbuilders able to build such a hull shape. Western Geophysical has, to date, used the conventional hull design because we believe it to be a more suitable platform for seismic acquisition for a variety of reasons, including stability and fuel efficiency, which lowers the costs for our clients. Stability that allows operations to continue safely in rough weather and complementary inwater technology is the best combination for our clients. What capabilities, such as streamer geometry, acquisition footprint, data capacity, etc., does your newest vessel(s) have that previous vessels did not?
CGG presently has streamer capacity of more than 100 km with the potential to tow up to 16 streamers on the Alizé. We are working on a new system that will separate the functions of deployment and retrieval from storage. Doing so will allow us to place more weight lower on the vessel, thereby reducing future vessel size or increasing the capacity of existing ones. Computer modeling indicates the Alizé will have the capacity to deploy spreads wider than 1,200 m. Use of this additional capacity for high-resolution surveys is still very minimal, perhaps 5% or so of today's market. We see a couple of clients, like Shell for instance, asking for a certain survey at 18.75-m bin or 12.5-m bin. We have been doing a 6-month survey offshore Nigeria with 18.75-m bin. Geco-Prakla routinely deploys 6-km streamers, and the slim, Nessie-4 streamers and large streamer reels will enable Geco Eagle to easily deploy streamers greater than 8 km.
Some contractors can tow wide configurations, albeit with the assistance of additional vessels, but do not offer long streamers. Geco Eagle will be equipped with our Monowing II deflector system, which, coupled with lightweight towing leads, has been experimentally proven to deliver 1,400-m spreads without the help of other vessels. We prefer not to require support from additional vessels, which can raise unit cost and incur additional safety and reliability risks. The highest capacity vessels in our fleet already deploy footprints up to 8 km2 unassisted, an industry record. Testing and computer modeling indicate Geco Eagle should have a footprint of up to 11 km2. With 20 potential tow points, the vessel will also be able to shoot very high-resolution 3-D. Veritas’ Viking class of vessels is currently equipped to deploy eight streamers. To date we have seen little market demand for anything more than this configuration. However, the deck plans are laid out in such a way that the upgrade path to up to 16 streamers, including hydraulic power capacity, is already built in, and we have the propulsion power to tow them all. We just do not want to charge our clients for something that they do not presently use. Western vessels can currently pull up to 12 streamers. The newest vessels are improved in every aspect. Horsepower and fuel endurance are improved by 40% and 50% respectively. These advances complement our state-of-the-art onboard processing center. Streamer capacity has also been increased by 33%. As streamers grow longer, problems can arise, such as signal-to-noise ratio, data transmission, etc. Do you envision 12-km2 footprints or 15,000-m streamers? What solutions for such problems do you employ and what is the future direction? Geco-Prakla feels that transmission of information along long streamers is not a limitation, whether seismic, acoustic, compass or other data. Although frequency loss at far offsets is inevitable, processing algorithms can compensate for this. Operational logistics are indeed an issue that we have addressed. Geco Eagle has a specially designed 36-ft workboat that is easy to deploy, is completely self-contained — with enclosed cabin and navigation system — and is very fast moving. It can pick up, exchange and store 100-m streamer sections, has underwater cameras and a unique streamer-cleaning system. Geco-Prakla vessels have already kept streamers deployed for well over a year and have encountered barnacles and other growths of amazing proportions. With her planned 5-year docking interval, Eagle’s streamers are likely to spend a very long time continuously deployed in the water. Western has virtually eliminated streamer front-end noise through development of solid-streamer technology. It is the perfect complement to an operations platform capable of safely extending the operations weather window. We have yet to see a single seismic trace produced by what is floating on top of the water. The company has improved the efficiency of wide-tow components and systems through the design and tank testing of innovative vanes and computer modeling of tow-system configurations. Veritas believes client interest in long-streamer operations is high. Actually, the biggest trend that we see from clients is demand for longer streamers, which we think tends to preclude towing more than eight of them with today’s towing technology. Veritas is at the forefront of deploying long streamers. Today, the average cable length deployed on our 3-D vessels is over 7,000 m. We are also the only contractor to have towed a 12-km streamer in production. The use of such streamer lengths does pose a number of technical problems. We had to work hard with our streamer-manufacturing partner, Syntron, to build custom made parts for this work. Some of the problems that we had to solve were: 1) new isolator (stretch) sections capable of isolating tow noise from the cable under much higher tow loads; 2) telemetry repeaters to boost communication of ancillary devices (cable levelers, etc.) on the streamer; and 3) boosted cable power supply. Our operational experience to date with streamers this long has taught us some valuable lessons which you can expect to see implemented in new cable features coming later this year. Repeatability can be a problem with 4-D surveys, especially where legacy data is used. As more modern technologies are implemented, repeatability should become easier to achieve, particularly with pre-planned 4-D. What are you doing in these areas? CGG. Let’s tell the truth. Everybody has a far-field signature that helps repeatability today. 4-D is the tool of tomorrow. Repeated surveys may be taken at 1- to 5-yr intervals during the life of the field, which may be 15 years or more. We have seen the level of change in this industry that occurs in 10 to 15 years, so we do not think that a survey that is shot today will be shot with the same kind of source, streamer or geometry in 10 to 15 years. There are two approaches. Suppose we want repeatability at the acquisition level, which of course is good, but in practice will probably not happen over 10 to 15 years. Maybe over a few years, but much longer is doubtful. The other method is to look to the processing side where we can compensate for repeatability problems, and can deconvolute the signal in such a way that we have an image of actual reservoir changes. At CGG, we are working much more on this side of the repeatability problem. Of course, we will try to bring as much repeatability to the client through acquisition as we can, but truthfully, the processing side will be the key to 4-D over the life of the field. We believe that 4-D will eventually be in high demand, although this is presently not the case. This will only occur when the cost of 3-D becomes much cheaper and the process advances. Finally, we feel that for the foreseeable future, 4-D/4C might not be low enough in cost when compared to streamer acquisition. There will be a tendency for the contractor to try to create a 4-D market, because they will create their own bread and butter. The future relies on bringing the client more information at a greatly reduced cost (see table). Geco-Prakla’s OBC (Ocean Bottom Cable) and its Nessie 4C seabed-streamer system provide high-fidelity seismic data and accurate and repeatable positioning. One of the most variable elements of a marine survey is the source. We measure the near-field signature of each gun, enabling our proprietary source signature estimator to estimate the far-field signature. This not only enables higher resolution through superior designature, but also greatly improves repeatability of multiple surveys. Careful processing helps maximize repeatability. Our data-analysis software is highly database driven, enabling accurate history tracking and easy repeat processing of legacy surveys. Our processing software helps indicate the distribution of reservoir fluid content and map changes between 4-D surveys. Veritas’ experience to date is that different areas have distinctly different 4-D signatures. In some cases, we have been able to show geophysical changes due to reservoir depletion from markedly different data sets with different techniques and instruments all over the same prospect. In other cases, we have seen little or no 4-D signature from carefully duplicated surveys. The use of 4C recording allows us to measure additional geophysical properties that may be helpful in establishing a 4-D signature in areas where no such signature is easily found today. With regards to OBC, we feel the market to date has not seemed ready to pay a rate to cover the additional cost of acquiring data in this way, unless there was no choice for some logistical reason such as water depths or obstructions. Accordingly, we see most of the OBC crews being laid up at present. When thinking about using OBC for 4-D work, the whole issue of differential signal due to the uncertain coupling of sensors to the seabed arises, and in some cases this can introduce more uncertainty than the 4-D signature that we are trying to measure. At Veritas, we are continuing to research these areas, but feel that the technologies are not yet sufficiently mature to encourage us to start to undertake full-scale field operations. Western has performed and published a comprehensive study of OBC repeatability (Beasley, et al., 66th International Meeting, SEG, 1996). This study indicates that "production" style OBC is highly repeatable. We believe this is largely due to the robustness of the geometry employed in the company’s Mega Survey program in the Gulf of Mexico. It is also a participant in the Teal South consortium, which is using the buried cable method. This is more an effort to learn about the repeatability process than acknowledgment of the need to bury the cable. Western has acquired multicomponent OBC data in nearly every operating region, and it is prepared to meet the current level of demand for such services. As part of its deep OBC development effort, it has developed a significant body of knowledge and experience regarding pre-mission and real-time capabilities for modeling of bottom referenced cable deployments. This technology is commonly used by pipeline and telecommunications industries as well as the military, in deploying, retrieving and servicing of very deepwater equipment. Acknowledgment
Literature Cited
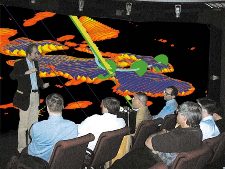
Immersive environments enhance team collaborationDoug Wille, Landmark Graphics, Houston The global petroleum industry is currently going through yet another difficult time of transition and consolidation driven by lower-than-expected crude prices. Innovative companies, that focus on productivity at any oil price, are destined to lead the industry and create more value for their stakeholders. How will they do it? By aggressively advancing their competitive technological capabilities through redesigning exploration, production and drilling processes; empowering asset teams with ever-higher levels of integration; and providing better training and technical support so their teams can extract the maximum value from their technology environments. The industry has embraced data integration, and is now beginning to experience new advantages through visual integration. Visual integration allows the combination of, and interaction with, many different data types. Seismic interpretations, 3-D reservoir models, well planning, engineering and information all can be displayed and, more importantly, analyzed and modified. Data integration, combined with visual integration, provides a powerful basis for integrated work process. Ease of collaboration. Despite these enormous strides in both data and visual integration, until recently it has been difficult to truly forge a common understanding among the diverse operational and technical professionals involved in solving complex exploration, drilling and production problems. Today, more than ever, it is vital that cross-functional, and even cross-company teams collaborate more effectively so that decisions can keep pace with the economic imperatives of today’s market. Teamwork has been an important goal in improving economic and technical success, as exploration and production problems require ever-broadening expertise. Most companies have worked to make this component of success a reality. Now, large visual environments are proving to be an enabling technology for success. An asset team of geologists and geophysicists, along with reservoir, production and drilling engineers, as well as partners, suppliers and managers, can all be immersed in a common, 3-D visual environment. Now they can literally "see" one another’s viewpoints and perspectives in real time. Building on a solid foundation of data and visual integration, they will identify problems faster, develop more comprehensive, better-integrated answers and, as a result, make better business decisions in less time. The achievement of this level of workflow integration is an essential factor for companies, to accomplish radically improved economic performance. Some companies are already beginning to experience step-change improvement in performance. Asset teams tackling such diverse problems as prospect evaluation, platform placement and well engineering have achieved better decisions in less time by working in a common, integrated visual environment. More than just an intriguing concept, immersive environments are proving to impact the bottom line by increasing production, reducing time to first oil and significantly saving on drilling costs. Global collaboration. Further, by using high-bandwidth communications technology to extend team-based workflow integration across vast distances, operational integration also can be enabled. The ability for two multidisciplinary teams — one in the office and the other on the platform — to share, interpret and act on complex technical information in real time, will have a substantial impact on the ability to find, develop and produce oil and gas on a global scale.
To demonstrate global collaboration, a national oil company set up a Trans-Atlantic immersive environment. The collaborative connection was made with ISDN communications technology. The geographically separated teams shared a common 3-D view of multidisciplinary data to plan a well, including seismic, well path, log curve and a reservoir simulation model. Video and audio conferencing enabled interactive communication throughout the entire process. "Despite being separated by thousands of miles, both teams experienced simultaneous changes in what they were seeing and experiencing," said Landmark geophysicist Jeff Coffman. "The ability to collaborate across organizational, geographic and professional boundaries will increasingly become a competitive advantage for exploring and producing oil and gas." Leading-edge companies recognize that visualization and virtual-reality technologies are key enablers to transforming their decision-making processes through collaboration. The change is not about technology or computing environments. The whole focus is on changing people’s behavior so that multidisciplinary teams can work together in fundamentally new ways to get better answers and improve business performance. Getting past the impasse. According to Karl Street, project manager in Landmark’s U.S. Finding Group, one U.S. independent used an immersive environment to solve an ongoing concern with a partner regarding a prospect. Discussions about possible well placement had been going on for several months, delaying project start-up. By bringing together geoscientists and management in an immersive environment, where data could be collectively viewed in greater detail, the geoscientists were able to explain their decisions more effectively and create a higher comfort level for management. Consequently, the partners reached agreement in less than eight hours and were able to begin work on the project within 30 days. "What this team found most beneficial was the fact that they could collaboratively look at and discuss extremely large data files in much greater detail on the large screen. Instead of one or two individuals viewing three to four blocks of data on a desktop system, the entire team was able to view up to 20 blocks at one time," said Street. Another example. A large multinational company embraced this new immersive and collaborative approach and is using it as an enabler to change the way its teams interact, make decisions and affect the bottom line. Landmark’s immersive Decisionarium environment, in conjunction with a team facilitator, allowed the team to model new behavior and develop their collaborative approach. In addition, they required their full asset team including geologists, geophysicist, drilling engineer, service-company member and asset manager to participate in the collaboration exercise. They pre-set goals which included determining an optimum deepwater template placement, planning a minimum of one well, assessing the feasibility of alternative "what if" designs and planning five primary targets. Because of the collaborative environment, the team was able to find and agree on an alternative well plan that eliminated the need for one of five planned wells. Due to the large screen, the team also was able to see the initial placement of a subsea template in such detail that a slump zone and shallow hazards were identified. This led to agreement on an alternate plan for placement of the template, and resulted in identification of potential safety issues while saving millions of dollars on the project. Not only did team members achieve all of their objectives, they were able to generate better alternative options than they would have had time to create otherwise. A process that normally took weeks to complete was accomplished in a day. Harald Norvik, Statoil CEO, stated during a demonstration, "Statoil’s advanced visualization center in Stavanger, Norway, is witness to a technological breakthrough. As a learning organization in a global environment, our ability to collaborate across organizational, geographical and professional boundaries is crucial to our corporate success. Today, we are experiencing an example where all these boundaries are being crossed. We will see people belonging to different companies, in different continents and from different disciplines working together." Conclusion. Today, by providing an
environment in which cross-functional teams of specialists can work together, visualization
and virtual-reality technology provides the first step toward a new leap in productivity.
Data and visual integration, combined with new immersive environments, has created dramatic
new possibilities comparable in significance to the introduction of 3-D seismic technology
in the 1980s. Throughout the next decade, immersive, collaborative environments will have as
much impact on team productivity as the interactive workstation has had on individual
productivity over the past decade. Copyright © 1999 World
Oil |
||||||||||||||||||||||||||||||||||||||||||||||||||||||||||||||||||||||||||||||||||||||||||||||||||||||||||||||||||||||||||||||||||||||||||||||||||||