Photoelectric log data aids deep-well completion decisions
Photoelectric log data aids deep-well completion decisionsWireline density tool uses photoelectric factor to create a density correction curve which, in the presence of barite, indicates permeable sections. The technique defined pay zones in small-diameter, deep wells in which micrologs could not be runThomas M. Maher, Apache Corp., Tulsa, Oklahoma; William Boykin, Halliburton Energy Services, Oklahoma City; and Dale R. Heysse, Halliburton Energy Services, Houston
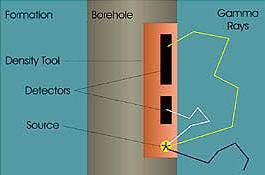
The operating principles of the tool, supplied by Halliburton Energy Services, are presented here. And example applications in Caddo County, Oklahoma, and Jackson Parish, Louisiana, deep wells are presented. MEASUREMENT PRINCIPLES Modern density tools measure formation density and formation photoelectric factor (Pe). The density measurement is used to calculate formation porosity, and the Pe measurement is usually used to determine formation lithology. Traditional density tools contain a chemical source of gamma rays and two gamma ray detectors, with source and detectors mounted in a pad that is pressed against the borehole wall. Gamma rays emitted by the source travel through the mudcake and into the formation, Fig. 1. Attenuation of gamma ray energy occurs in both mudcake and formation. Some of the gamma rays continue traveling away from the tool, but others are scattered by the formation back to the detectors in the logging tool. Two detectors are used to correct for mudcake effects on density and Pe measurements.
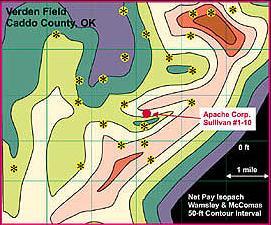
Gamma rays returning to the tool are measured in two energy ranges, low and medium. The low-energy measurement yields Pe, an indicator of the formation’s capability to attenuate low-energy gamma rays which, in turn, is an indicator of formation lithology. The medium-energy measurement is an indicator of the number of electrons per unit volume in the formation, which yields density. Because low-energy gamma rays cannot travel very far, the depth of investigation of the Pe measurement is relatively shallow, about 1 in. Medium-energy gamma rays can travel farther than low-energy rays; therefore, depth of investigation of the density measurement is greater than the Pe measurement, about 3 to 5 in. Pe measurements are highly affected by materials in the borehole and formation that have a high atomic number (Z). For comparison, quartz, dolomite and calcite are low-Z materials and have Pe values of 1.8, 3.1 and 5.1, respectively. However, barite, a high-Z material, has a Pe of more than 100. Thus, when a borehole loaded with barite-weighted mud penetrates a permeable zone, mud filtrate will invade the zone, leaving a barite-concentrated mudcake on the borehole wall across that zone. The Pe measurement, having shallow depth of investigation, is strongly affected by even a thin, high-Z mudcake and gives a high Pe value that is no longer indicative of formation Pe. However, these anomalously high measurements now have value as permeable-zone indicators. Because barite has such high density, it also has a significant effect on the density measurement. This effect is reflected in negative density corrections seen on D p (density correction) curves on density logs. Thus, the D p curve can also serve as an indicator of permeable zones when barite-weighted mud is used. A similar effect on D p can occur in washed-out shale intervals, so such sections must be ignored. FIELD EXAMPLES: SELECTING COMPLETION INTERVALS To successfully drill and complete deep, overpressured wells in the Anadarko basin in Oklahoma and the North Louisiana Salt basin, the operator needed a method to identify permeable zones in tight heterogeneous sandstone formations. Microlog tools could not be run safely in these wells because of the tendency for tool sticking and mechanical failure in the small, 6-1/2-in. boreholes. Further, because of low water saturations and high formation resistivity in these tight zones, it had been impossible to establish a reliable correlation between permeability and separation of the microlog resistivity curves when micrologs had been run. To solve the problem, the operator ran density logs on which Pe measurements could be displayed and used as a permeability indicator in the barite-weighted muds. In addition, the D p curve on the density logs was used as an auxiliary permeability indicator. Zones in which the Pe value was greater than 8 and the D p value was negative were identified as having sufficient permeability to warrant completion. Caddo County, Oklahoma. Fig. 2 is an isopach map showing the location of a well drilled with barite-weighted mud in Verden field. Drilling operations targeted Upper, Middle and Lower McComas formations in the Springer Group, of Lower Pennsylvanian age, at about 17,000 to 18,000 ft. The depositional environment is a submarine fan complex offering up to 300 ft of pay thickness for gas production. The objective was to produce from the three stacked formations that followed a submarine channel axis. These formations are well-sorted, very-fine-grained to fine-grained sandstones that are moderately compacted. Quartz content is 94 to 96%, with 4 to 6% clay, mostly illite.
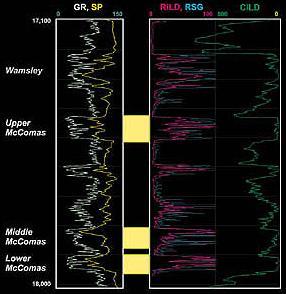
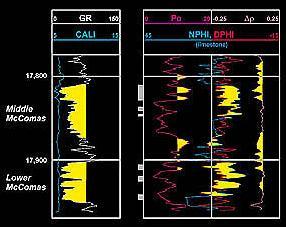
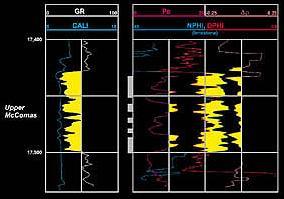
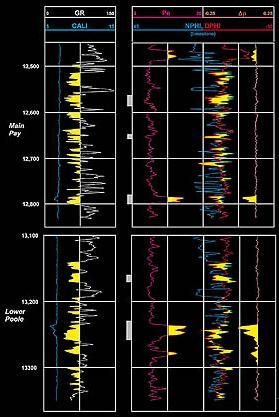
Fig. 3 shows an induction log run over the three zones; Fig. 4 and Fig. 5 present neutron-density logs run over the McComas. On the neutron-density logs, the low gamma ray values have been highlighted to indicate reservoir-type rock — sandstone, in this case. High Pe and negative D p values have also been highlighted to indicate permeable zones. Additionally, regions in which the density-derived porosity exceeds the neutron-derived porosity have been shaded to indicate formation gas. Intervals that were ultimately perforated are flagged in the depth track. Note: some washed-out shale sections, such as at 17,800 ft in Fig. 4 and 17,450 ft in Fig. 5, also exhibit high Pe and negative D p, but these values are due to hole caving and not barite mudcake.
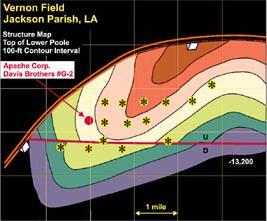
The Lower McComas showed the least barite effect of all three formations. A 20-ft section was selected for perforating and fracing, after which the zone tested at 500 Mcfd at 720 psi on a 14/64-in. choke. A sand plug was set above this zone. The upper section of the Middle McComas displayed significant barite mudcake effect, not only on Pe and D p curves, but also on the caliper curves, i.e., reduced caliper values due to the thick mud cake. Again, a 20-ft section was selected for perforating / fracing. This zone tested at 3.5 MMcfd at 3,100 psi on a 14/64-in. choke. In the Upper McComas, the gamma ray curve indicated good sand development across the complete interval. Barite mudcake effects are noticeable on the Pe curve and even more so on the D p curve. All permeable sections, about 50 ft, were perforated and hydraulically fractured; and the zone subsequently tested 10.1 MMcfd at 7,800 psi on a 12/64-in. choke. Current production from the three McComas sands in this well is 4.6 MMcfgd and 35 bopd. Cumulative production since June 1994 has been 8.0 Bcf gas and 101,000 bbl oil. Jackson Parish, Louisiana. Fig. 6 is a structure map showing the location of a well drilled to below 14,000 ft in the Vernon field. Target formations included the Main Pay and the Lower Poole, located in the Upper Jurassic Cotton Valley group. Both are well-sorted, shaly sands. The Lower Poole is fine-grained, while the Main Pay is very fine- to fine-grained. These formations are part of a faulted anticline that was originally deposited as a distal delta front.
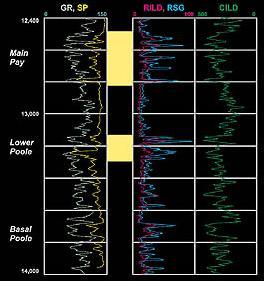
Fig. 7 shows an induction (resistivity) log run over the two target zones. Fig. 8 displays the neutron-density logs run over the same zones. The shading conventions used in these logs are the same as those used in the logs of Fig. 4 and Fig. 5.
The neutron-density log over the upper section of the Lower Poole exhibited no barite mudcake effect on either Pe or D p curve. However, barite mudcake effects are readily visible on the lower section. Thirty feet of the Lower Poole sand was perforated at 6 spf and then hydraulically fractured. The zone tested at 4.2 MMcfd at 3,100 psi on a 14/64-in. choke. In the Main Pay sand, only 12 ft of barite mudcake effect was discernible on either the Pe or D p curve. Thirty-four feet of this zone was perforated at 6 spf. After fracing, the zone tested 1.7 MMcfd at 1,800 psi on a 15/64-in. choke. STIMULATION DIAGNOSTICS EXAMPLE Use of Pe data as a permeability indicator has also proved helpful in redesigning a stimulation job. In a recently completed Deep Springer well in Caddo County, Oklahoma, a 300,000-lb bauxite frac job screened out after pumping only 30,000 bbl. When the operator examined openhole logs from the well, the Pe curve identified a 20-ft permeable zone at the bottom of the perforated interval. The consensus was that this zone had preferentially taken all the frac fluid, causing premature screenout. Consequently, a sand plug was set above this 20-ft zone, and the well was refraced with 250,000 lb of bauxite. The second job was successful, and production from the well increased to 10.5 MMcfgd from 6.3 MMcfgd. CONCLUSIONS Although Pe data is unreliable for lithology identification in wells drilled with barite muds, this data has proved to be an extremely useful indicator of permeable zones in such wells. This information has been successfully used in field practice to select where wells should be perforated for optimum production, and to diagnose stimulation problems. In wells in which hole size or formation conditions do not allow
micrologs to be run, Pe curves should be displayed on
density logs and used as permeability indicators. Slimhole, hostile
environment tools are available for obtaining density and Pe
measurements in hole sizes as small as 3-1/2-in. and at temperatures
and pressures up to 500° F and 25,000 psi.
|
|||||||||||||||||||||||||||||||||||
- Applying ultra-deep LWD resistivity technology successfully in a SAGD operation (May 2019)
- Adoption of wireless intelligent completions advances (May 2019)
- Majors double down as takeaway crunch eases (April 2019)
- What’s new in well logging and formation evaluation (April 2019)
- Qualification of a 20,000-psi subsea BOP: A collaborative approach (February 2019)
- ConocoPhillips’ Greg Leveille sees rapid trajectory of technical advancement continuing (February 2019)

