2012 Forecast: Oil is oil and gas is gas, will the twain meet?
Oil prices are likely to remain high with relatively small differences in prices between regions. Natural gas prices, however, are likely to remain low–to-moderate in North America with large differences between regions of the world due to high transportation costs.
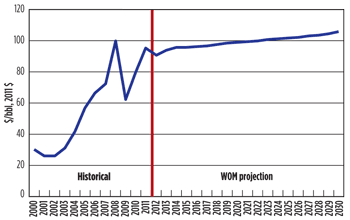
BILL ENGLISH and TOM CHOI, Deloitte MarketPointOil and gas price forecasts are at the heart of many decisions in the oil industry. This article discusses Deloitte MarketPoint LLC’s (DMP) price forecasts for crude oil and natural gas, which are based on a number of assumptions and developed using DMP’s World Oil Model (WOM) and World Gas Model (WGM). We explore some of the key data and assumptions used and discuss why we believe these prices will be less related in the future. OIL PRICES Figure 1 shows historical prices and WOM results for widely followed marker crude, West Texas Intermediate (WTI). The chart is presented in 2011 real prices, suggesting that today’s high price levels will persist, with the trend rising gradually in real terms in the medium term.
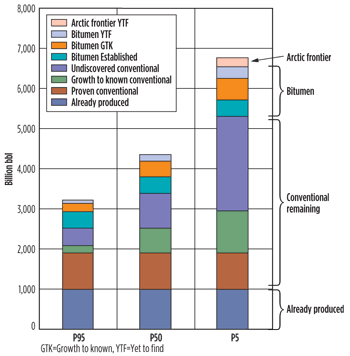
Supply. One of the biggest factors affecting future oil prices is future oil supplies – and there is significant controversy and uncertainty about how much recoverable resource remains. For our models, we use resource assessments from the United States Geological Survey (USGS) World Assessment, updated and supplemented by subsequent USGS assessments of individual regions or plays, as well as other sources, Fig. 2. The USGS assessed each producing region and prospective area for undiscovered recoverable resource within 5%, 50%, and 95% confidence levels. For estimates derived from other sources, we applied our own analysis to estimate the 5% and 95% confidence levels. Growth to known reserves was also evaluated and included. For the purposes of this article, we used the 50% confidence case.
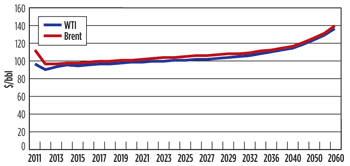
While the quantity of resource of crude in each region is important, this is only part of the equation. We must also consider “at what cost” for each next increment of production. For the model results presented here, we have used our own analysis to arrive at the required marginal cost vs. cumulative resource curves for each crude type and region, although industry participants can and do create alternative cases. The cost of oil exploration and development is an important differentiator between oil and gas. Oil is at a more mature stage of development, requiring the industry to move to more expensive sources of supply. While our analysis demonstrates that approximately $100 oil will support a large number of projects, this price is needed to continue to move into deeper water, develop tighter formations and increase recovery from known resource. This contrasts with gas, which is in a much earlier stage of development, so there are still large new gas discoveries, which can be developed at much lower costs than oil reserves. Brent-WTI spread. Figure 3 shows model results for the two widely followed marker crudes, WTI and Brent. The figures below are presented in 2011 real prices, suggesting a convergence between the two indices.
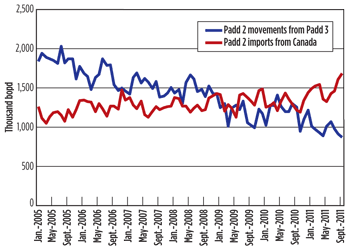
In the oil market, very large price differences between regions are unusual. High liquidity and relatively low transportation costs usually keep regional price differences much lower for oil than for gas. In 2011, the Brent-WTI spread went through an unprecedented swing. The conventional wisdom has been that with increasing imports from Canada, U.S. Padd 2 is surplus and this surplus—and the Brent-WTI spread—can only be relieved by building a new pipe from Cushing, Oklahoma, (Padd 2) to Houston in Padd 3. Instead, after reaching $27 in September 2011, the Brent-WTI spread rapidly narrowed to about $10. As Fig. 3 shows, our model results in the WTI-Brent spread narrowing further in 2012 to settle at about $3 or less. Why? See Fig. 4.
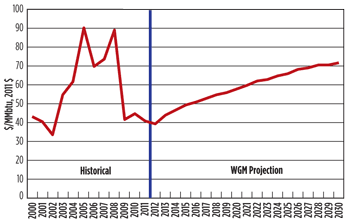
Padd 2 is actually importing nearly 1 million bopd of crude from Padd 3. Although imports from Canada (and higher Padd 2 crude production) have been reducing movements from Padd 3 to Padd 2, there is still a large flow northward. Then why has the WTI-Brent spread been under such pressure? In our analysis, the answer lies in the historical pipeline configuration, oil supply contracts, and company internal transfer pricing. The pipeline system out of Texas (Padd 3) was developed over the years to deliver increasing amounts north to Cushing, Oklahoma, in Padd 2 and to the northern Midwest. Some of the crude flowing north is doing so because it has no other place to go until pipelines are reconfigured. This work is expected to include reversing and/or expanding segments and, in one case, converting a pipeline back to crude from product service. Prominent among these projects is the expected reversal of the Seaway pipeline between the Gulf Coast and Cushing. The 150,000 bopd first stage of this reversal is expected in mid-2012 and a second stage may be operational in early 2013 to raise capacity to 400,000 bopd. Not all crude flowing north can be explained by pipeline configuration. We believe the remaining oil is flowing under contracts and internal transfer prices that price off Cushing. As these agreements are renegotiated, we expect a further decline in the spread. Near-term geopolitical dynamics. In our analysis, recent market constraints, such as the Libya production shut-in, are gradually relaxed to allow the market to reach equilibrium over the next few years. Figure 3 shows the equilibrium trend. While our chart suggests that prices will then rise smoothly, in the real world, prices are expected to continue to be volatile, going above and below equilibrium. Unexpected events tend to push prices up more frequently than down. Of course, actions by Iran, Iraq and Saudi Arabia will have an impact on the trend. We have assumed Iraq will expand production rapidly, although not as fast as Iraqi forecasts. Iran’s production has declined due to tightening UN sanctions and their impact on access to foreign contractors and parts. We anticipate continued decline in Iranian production for a few years but expect that at some point in the future Iran will be “brought into the fold” and will again be able to grow production. Saudi Arabia has a balancing act to play. In the near term, rapidly rising production from Iraq, rising production in Libya and certain other areas of the world, combined with a potential slowing in the growth rate of world demand, is expected to offset Iran’s decline in production. However, Saudi Arabia increased expenditures for social programs after the Arab Spring. As a result, some expect Saudi Arabia to reduce production below 9.5 million bopd to defend prices. Our model suggests such a production reduction is not necessary. In the case shown, Saudi Arabia is held at 9.5 million bopd through 2012 and then allowed to increase slowly. Demand wild cards. There are significant uncertainties regarding worldwide oil demand for transportation fuels and for electric generation. These two demand sectors are important uncertainties for natural gas too, but natural gas and oil are going in opposite directions. High oil prices are stimulating new technologies, including for light duty vehicles. These range from improvements in engine and vehicle design for conventional internal combustion engines to hybrids, plug in hybrids, all electric and natural gas vehicles. Within our WOM, each of these technologies competes for vehicle miles. The resulting hydrocarbon fuel consumption in the WOM is significantly lower than one would obtain by projecting historical fuel use to the future. The speed and degree of adoption of these alternate technologies depend heavily on future technology improvements, particularly for battery cost and efficiency, government regulations and fuel costs. The case presented here includes assumptions for technology improvements at rates that we believe may be achievable for each. The resulting rapid moderation in the growth of transportation fuels at high prices contributes to the relatively flat crude price projection. Natural gas use for transportation is currently very small but growing and has considerable, but uncertain, potential in some areas due to its cost and low emissions. The amount of oil, both diesel and residual fuel, consumed for electric generation remains something of an enigma. Oil bears a high premium for its ability to pack a lot of energy in an easily transportable form. This makes it very valuable as a transportation fuel. As a result, oil prices are significantly higher on a btu basis than fuel used in electric generation. Therefore, economic theory suggests that base load electricity demand should be met some other way. This has largely happened in North America and Europe, but many parts of the world continue to use oil for electricity. In the case presented here, we have assumed that a portion of oil consumption for electricity competes freely with other fuels, while the balance is locked in as discussed above. In our model, this locked-in consumption gradually declines over time to a base level. As a result, residual fuel consumption is lower in future years than forecast by many others. NATURAL GAS PRICES Although it now seems only a distant memory, natural gas prices in the U.S. only a few years ago were hovering at elevated levels never before sustained. NYMEX futures prices in mid-2008 were over $10/MMBtu and climbing. Many in the industry feared that last of the big gas fields had already been discovered, implying rising production costs, high domestic prices, and need to import massive volumes of LNG. Fast forward just three years, and prices have fallen to levels few suspected possible. The so called “shale gas revolution” has transformed vast, previously uneconomic North American shale gas deposits into valuable energy resources. To continue growth in shale gas production, large capital investments are required. Many question whether current prices are sufficient to support future production. Furthermore, as the shale gas “sweet spots” are depleted and producers need to shift to lower quality fields, prices will likely firm. On the other hand, continued technological advancements could help maintain low gas prices in the U.S. It is possible that prices will need to firm above current levels for production to continue, but could remain well below the levels seen a few years ago. Figure 5 compares Deloitte MarketPoint’s projection to historical prices at Henry Hub. Prices firm well above current price levels, but do not approach the high levels seen several years ago. The prices in the future assume rising long-run marginal cost of production.
Regional spreads. A critical issue is whether the U.S. market will converge with the European and Asian markets. While the benchmark Henry Hub price has been holding at under $4/MMBtu, prices in the Asian and European markets have consistently been in excess of $10/MMBtu. The wide margins between the U.S. and key markets around the world have prompted several companies to consider LNG exports from the U.S. They are projecting that these margins will continue to be sufficiently wide to support costly LNG liquefaction at U.S. Gulf terminals and shipments to foreign markets. However, Asian and European markets will likely see increased competitive pressure as global LNG supplies continue to climb and new international pipelines enable access to more supplies. Furthermore, the shale gas revolution could spread to other countries. After all, the same technology will be made available globally as the same companies who develop shale gas in North America seek to leverage their technologies in other countries. Foreign countries are actively investing in North American E&P projects, which is likely due in part to a desire to learn and acquire these technologies so that they can be applied in their domestic supply projects. Will shale gas production in Asia and Europe be sufficient to transform these markets to a similar extent that North American markets have been transformed? Our view is that shale gas production will come in large volumes only in certain basins around the world. The EIA reports massive potential volumes of shale gas distributed throughout the world. However, large volumes of gas resources do not necessarily equate to large production volumes. The quality and production cost of shale gas varies greatly by basin, depending on layer thickness, gas concentration and other geological factors. Furthermore, there needs to be sufficient volumes of low-cost water for use in the hydrofracing process and urbanized development areas, particularly in Europe, pose practical and political challenges. The two areas in which shale gas seems most promising are in Poland and China, both with significant high-quality shale gas volumes. The Chinese, in particular, seem intent on developing their domestic shale gas resources. Could a global gas market emerge that would bring U.S. gas prices in line with the rest of the world? After all, for oil there are relatively small differences across regions. The cost of transportation from producing to consuming country only adds at most a few percent to the delivered cost of oil at current prices. However, the cost of gas liquefaction and transportation could add 100% or more to the delivered cost of natural gas. The high cost of transportation will likely prohibit natural gas from attaining the high degree of liquidity that oil has and will support large price differences between some regions. Even though high transportation costs could prohibit high liquidity, prices in various regions could move closer to each other, due to similarities in supply costs. After all, gas production throughout the world uses similar technologies and requires similar input factors (e.g., steel), which are globally traded. While commonalities of production would draw prices towards each other, regional differences in resource quantity, quality and market structure limit how closely they converge. Hence, fundamental forces imply regionally set prices with some inter-regional linkages, rather than a highly liquid global market with a common global gas price. Large price differences between the U.S. and key markets in Asia and Europe could persist, although the spreads will likely shrink from current extreme levels as global LNG supplies increase and new international pipelines come into service. RELATIONSHIP OF OIL AND GAS PRICES In recent years, oil and gas prices have not tracked each other very well nor have they followed traditional ratios. While many analysts assume they should correlate, we make no assumptions on price relationship, but rather model how they interact in the marketplace and prices are model results. For prices to be highly correlated, the commodities should either be substitutes for one another or derive from a common source. In the past, oil and natural gas were both commonly burned for electric generation and industrial processes all over the world, so they were, to a degree, substitutable. That is no longer true, as natural gas and coal have steadily displaced oil, particularly in the North American and European markets for power generation and heating. Although there are few fundamental market reasons for oil and gas prices to be linked, these prices are linked through contractual mechanisms in many parts of the world. Gas supply and transportation contracts are typically pegged to oil price in Europe and Asia. Furthermore, oil-indexed contracts typically have a take-or-pay volume that the buyer will accept and an optional volume that the buyer can choose to accept at an oil-indexed price. The significance of the flexible volume is that the oil-price indexed volumes could be at the margin and set the spot price. Therefore, even as currently highly regulated European and Asian markets evolve to competitively set prices, prices in these markets could still be linked to oil price through contracts. This price linkage is clearly observable during high-demand periods in which markets must rely on contractual volumes to meet demand and prices hover around the oil-indexed price. During low-demand periods, when make-up volumes are not required, gas prices can drift well below the oil price equivalent. For natural gas and oil prices to be more fully correlated in the future, natural gas must be more competitive in the transportation sector. In order for natural gas to make substantial headway into the transportation sector, it must first overcome certain challenges, including the following:
Some of these challenges can be tractably overcome in commercial fleets, such as taxis and delivery vans. Only when natural gas can compete with oil as a transportation fuel on a meaningful level would we expect to we see their prices become reconnected again. CONCLUSION By modeling oil and natural gas markets based on a number of assumptions and using sound economics and market fundamentals with MarketBuilder, our analysis demonstrates that oil and natural gas prices are driven by different factors and are not likely to be well correlated in the near future. Oil prices are likely to remain high with relatively small differences in prices between regions. Natural gas prices, however, are likely to remain low-to-moderate in North America with large differences between regions. We have presented a single case. Given the inherent uncertainties in fundamental data and assumptions, such as recoverable resource quantity, undeveloped resource cost, and demand, further analysis, including consultation with a professional service advisor and a range of cases, is recommended before making large capital decisions to help identify possible risks and evaluate the robustness of possible capital plans. DISCLAIMER ABOUT DELOITTE MARKETPOINT Deloitte MarketPoint LLC, the result of Deloitte’s acquisition of substantially all the assets of MarketPoint Incorporated and Altos Management Partners (MarketPoint/Altos) in 2011, combines the global strength and quantitative experience of Deloitte and the member firm network of Deloitte Touche Tohmatsu Limited with the market-leading software and time-tested energy market success of MarketPoint/Altos. Deloitte MarketPoint is located within the Deloitte Center for Energy Solutions.
|
|||||||||||||||||||||||||
- Prices and governmental policies combine to stymie Canadian upstream growth (February 2024)
- U.S. producing gas wells increase despite low prices (February 2024)
- U.S. drilling: More of the same expected (February 2024)
- U.S. oil and natural gas production hits record highs (February 2024)
- U.S. upstream muddles along, with an eye toward 2024 (September 2023)
- Canada's upstream soldiers on despite governmental interference (September 2023)

