U.S. oil and natural gas production hits record highs
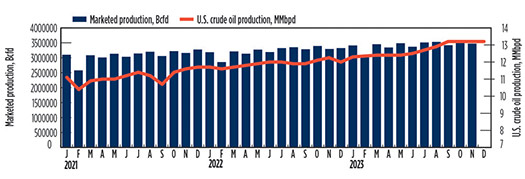
Despite a 4.6% reduction in U.S. drilling activity on an average yearly basis, U.S. crude production climbed to an all-time high of 12.93 MMbopd in 2023, an 8.8% increase compared to the 11.88 MMbopd average of 2022. The increased output was augmented by U.S. operators completing a large backlog of DUCs in three major oil shale plays. WTI started 2023 at $78.12/bbl, then climbed steadily throughout the year, due to restricted Russian supply caused by the war in Ukraine, tensions in the Middle East, and OPEC+ production cuts. WTI crude prices hit a yearly high in September 2023 at $89.43/bbl, before falling back down to $71.90/bbl in December.
CRUDE AND CONDENSATE
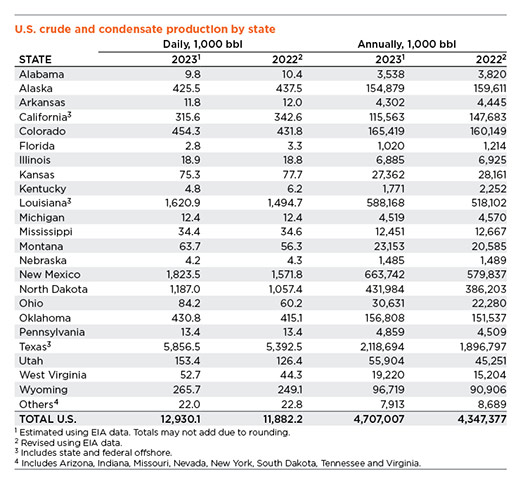
As noted, U.S. oil production increased during 2023, with noticeable gains in New Mexico, up 16% to average 1.82 MMbopd (+251,700 bopd), North Dakota, up 12% to 1.19 MMbopd (+129,600 bopd), Texas up 8.6% to 5.86 MMbopd (+464,000 bopd) and Louisiana (including federal waters), which jumped 8.4% to 1.62 MMbopd (+126,200 bopd) as renewed activity in the GOM started to come on-line. The inverse correlation, i.e. a reduction in drilling activity but higher crude output, is due to improved efficiencies in U.S. shale operations and companies completing wells in their extensive DUC inventory in North Dakota, New Mexico and Texas. In the Bakken region, operators completed 208 mothballed wells (-39%), while the Eagle Ford play saw a reduction of 156 archived wellbores (-31%), both on a y-o-y basis. Operators working the Permian basin reduced the number of temporarily abandoned boreholes by 22%, completing 239 wells.
Western states. Despite Colorado’s multiple green initiatives, crude output jumped 5.2% in 2023, increasing to 454,300 bopd, while Wyoming posted a 6.7% gain, up to 265,700 bopd, 16,600 bopd more than reported in 2022. In California, waning drilling activity, which first started in 2015, continues to negatively impact the state’s production, which dropped to 315,600 bopd in 2023, a decline of 7.9% after a 7.3% drop in 2022. A 21.4% increase in Utah pushed that state up to 153,400 bopd, 27,000 bopd more than averaged in 2022. Production in Alaska declined 2.8% in 2023, down to 425,500 bopd, after averaging 437,500 bopd in 2022.
In the Mid-continent, production in Oklahoma was up 3.8%, with several operators completing high-flow oil wells in the state’s SCOOP and STACK plays. These highly commercial producers pushed the state’s output to 430,800 bopd, up from 415,100 bopd in 2022. Despite virtually no shale activity, operators working in Kansas managed to maintain crude production at 75,300 bopd in 2023, a 3.1% reduction in output. Drilling and footage in Kansas should be up 18% and 16%, respectively, with 90% of the new wells (1,200) targeting oil. In Ohio, which produces more liquids than its neighbors, the number of new drilling permits issued to companies exploring the Utica shale increased substantially in 2023, compared to the previous two years. The increased activity drove production in the state up a whopping 39.9% in 2023 to 84,200 bopd after a 22% gain in 2022 (60,200 bopd), making the Buckeye state the largest oil producer in the Appalachia region, 60% more output than West Virginia (52,700 bopd).
NATURAL GAS
Henry Hub spot prices averaged just $2.54/MMBtu in 2023, 60% less than in 2022 ($6.42/MMbtu) due to excessive casinghead gas from U.S. shale fields. Even robust LNG exports to Europe could not help lift depressed commodity prices. Prices peaked at $3.27/MMbtu in January before plummeting to $2.15/MMBtu in May before recovering to $2.52/MMbtu in December. EIA predicts the annual average U.S. benchmark Henry Hub spot price will remain under $3.00/MMBtu in 2024 and 2025. Record natural gas production and storage inventories mean that natural gas prices are less than half the relatively high annual average price in 2022. EIA forecasts HH spot prices to average $2.70/MMBtu in 2024. The agency expects HH price to climb to $2.90/MMBtu in 2025, as LNG exports increase.
Gas production/storage The EIA predicts U.S. dry natural gas production will grow between 1% and 2% or 1.5 Bcfd in 2024 and 1.3 Bcfd in 2025, down from growth of 4.0 Bcfd in 2023. The slowing growth reflects a drop in natural gas production associated with oil output in the Permian basin. U.S. natural gas production should reach 105 Bcfd in 2024 and 106 Bcfd in 2025—both would be record highs. EIA estimates that the U.S. began 2024 with 14% more natural gas in storage than the previous five-year average. Although demand growth is forecast to outpace supply growth by 0.7 Bcfd this year, inventories will remain high enough to limit significant upward pressure on prices. EIA expects U.S. LNG gross exports to rise 5% in 2024 to 12.4 Bcfd, up from 11.8 Bcfd in 2023.
Related Articles- Shale technology: Bayesian variable pressure decline-curve analysis for shale gas wells (March 2024)
- What's new in production (February 2024)
- Prices and governmental policies combine to stymie Canadian upstream growth (February 2024)
- U.S. operators reduce activity as crude prices plunge (February 2024)
- U.S. producing gas wells increase despite low prices (February 2024)
- U.S. drilling: More of the same expected (February 2024)

