OUTLOOK 2004: United States
Producing Oil Wells
Still phasing out low-volume pumpers
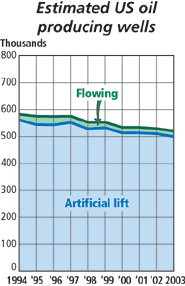
Despite the rebound of crude oil prices in mid-2002, and then again in early 2003, the number of US producing oil wells continued to decline last year, as reported by state agencies and estimated by World Oil. Overall, the decrease was 8,475 wells, or 1.6%. In Texas, with by far the largest number of oil wells, the Railroad Commission reported 3,137 fewer wells, a 2.0% drop, from 157,565 in 2002. Districts 7C, 8 and 8A, with over 70,000 wells, held essentially steady due to their emphasis on secondary recovery via CO2 injection. Other Texas areas generally took 2 to 5% of their older wells out of service.
Elsewhere, in states with large numbers of oil wells and high percentages of low-volume strippers – such as Kansas, down 1.3% to 40,500; Ohio, down 2.8% to 28,998; Pennsylvania, down 4.5% to 22,334; and Kentucky, down 4.8% to 18,166 – operators still could not see the economics of buying higher cost power to turn shut-in oil wells on. Gas-well development lets them sell $4 to $5 gas to power companies rather than buy high-cost electricity for oil strippers.
California retained most of its 2002, 46,734 oil wells within its heavy-oil recovery program. And, in the Rocky Mountains, Wyoming, Colorado and Montana took 2.2%, 1.8% and 3.7% of their wells off active producing status, respectively. In Southeast New Mexico, secondary recovery gave a 2.5% increase to 24,754 wells, with 2,437 flowing. Mid-western states of Illinois and Indiana dropped 2.2% and 1.5%, respectively, to 16,737 and 5,001 wells. Michigan, however, bucked the trend with a 1.9% increase to 3,800 wells. Regarding drilling new oil wells to boost the producing numbers, most rigs are drilling for gas, and operators see little incentive to drill infill wells in known producing areas, about the only targets left for most US operators. 
| |
Estimated US wells producing oil at the end of 2003 |
|
|
State or district |
Oil wells – 2003
|
Total oil
wells, 2002 |
% Diff.,
2003 –
2002 |
|
|
Flowing |
Artificial
lift |
Total
wells |
|
|
|
|
|
Alabama |
51 |
759 |
810 |
812 |
–0.2 |
|
|
Alaska |
541 |
1,093 |
1,634 |
2,080 |
–21.4 |
|
|
Onshore |
497 |
887 |
1,384 |
1,897 |
–27.0 |
|
|
State water |
44 |
206 |
250 |
183 |
36.6 |
|
|
Arizona |
0 |
17 |
17 |
20 |
–15.0 |
|
|
Arkansas* |
53 |
6,674 |
6,727 |
6,935 |
–3.0 |
|
|
California** |
2,120 |
44,230 |
46,350 |
46,734 |
–0.8 |
|
|
Colorado* |
0 |
5,941 |
5,941 |
6,050 |
–1.8 |
|
|
Federal OCS |
1,704 |
2,374 |
4,078 |
3,984 |
2.3 |
|
|
GOM |
1,666 |
1,961 |
3,627 |
3,521 |
3.0 |
|
|
Pacific* |
38 |
413 |
451 |
463 |
–2.6 |
|
|
Florida* |
20 |
50 |
70 |
73 |
–4.1 |
|
|
Illinois |
7 |
16,730 |
16,737 |
17,113 |
–2.2 |
|
|
Indiana |
250 |
4,751 |
5,001 |
5,076 |
–1.5 |
|
|
Kansas* |
550 |
39,950 |
40,500 |
41,016 |
–1.3 |
|
|
Kentucky |
4 |
18,162 |
18,166 |
19,074 |
–4.8 |
|
|
Louisiana |
1,657 |
18,527 |
20,184 |
20,987 |
–3.8 |
|
|
North |
779 |
15,599 |
16,378 |
17,044 |
–3.9 |
|
|
South |
783 |
2,731 |
3,514 |
3,619 |
–2.9 |
|
|
State waters |
95 |
197 |
292 |
324 |
–9.9 |
|
|
Michigan |
368 |
3,432 |
3,800 |
3,730 |
1.9 |
|
|
Mississippi |
460 |
2,430 |
2,890 |
2,924 |
–1.2 |
|
|
Missouri* |
0 |
352 |
352 |
364 |
–3.3 |
|
|
Montana* |
125 |
2,743 |
2,868 |
2,979 |
–3.7 |
|
|
Nebraska* |
0 |
1,097 |
1,097 |
1,155 |
–5.0 |
|
|
Nevada* |
22 |
41 |
63 |
65 |
–3.1 |
|
|
New Mexico |
3,217 |
24,310 |
27,527 |
26,701 |
3.1 |
|
|
North/West |
780 |
1,993 |
2,773 |
2,551 |
8.7 |
|
|
South/East |
2,437 |
22,317 |
24,754 |
24,150 |
2.5 |
|
|
New York |
0 |
3,106 |
3,106 |
3,213 |
–3.3 |
|
|
North Dakota* |
172 |
2,947 |
3,119 |
3,242 |
–3.8 |
|
|
Ohio |
48 |
28,950 |
28,998 |
29,838 |
–2.8 |
|
|
Oklahoma |
0 |
83,389 |
83,389 |
82,889 |
0.6 |
|
|
Pennsylvania* |
200 |
22,134 |
22,334 |
23,386 |
–4.5 |
|
|
South Dakota |
0 |
150 |
150 |
155 |
–3.2 |
|
|
Tennessee |
0 |
420 |
420 |
510 |
–17.6 |
|
|
Texas** |
7,499 |
146,929 |
154,428 |
157,565 |
–2.0 |
|
|
District 1 |
295 |
15,936 |
16,231 |
17,024 |
–4.7 |
|
|
District 2 |
180 |
1,777 |
1,957 |
2,006 |
–2.4 |
|
|
District 3 |
1,008 |
6,652 |
7,660 |
7,905 |
–3.1 |
|
|
District 4 |
187 |
1,842 |
2,029 |
2,179 |
–6.8 |
|
|
District 5 |
119 |
2,150 |
2,269 |
2,765 |
–17.9 |
|
|
District 6 |
598 |
7,858 |
8,456 |
8,687 |
–2.7 |
|
|
District 7B |
479 |
10,476 |
10,955 |
11,498 |
–4.7 |
|
|
District 7C |
985 |
10,422 |
11,407 |
11,404 |
0.0 |
|
|
District 8 |
2,352 |
36,375 |
38,727 |
38,745 |
0.0 |
|
|
District 8A |
389 |
21,431 |
21,820 |
21,812 |
0.0 |
|
|
District 9 |
720 |
21,798 |
22,518 |
23,096 |
–2.5 |
|
|
District 10 |
187 |
10,212 |
10,399 |
10,444 |
–0.4 |
|
|
Utah |
59 |
1,896 |
1,955 |
1,927 |
1.5 |
|
|
Virginia* |
0 |
8 |
8 |
8 |
0.0 |
|
|
West Virginia* |
179 |
7,488 |
7,667 |
8,028 |
–4.5 |
|
|
Wyoming* |
322 |
9,610 |
9,932 |
10,160 |
–2.2 |
|
|
|
|
|
Total US |
19,628 |
500,690 |
520,318 |
528,793 |
–1.6 |
|
|
|
|
|
|
|
|
|
|
*World Oil estimate **Includes state waters |
|
|
|