Tracking key performance indicators eliminates unnecessary downtime.
Klas Eriksson, Arve Værnes and Gunder Homstvedt, Aker Solutions Norway
Subsea pumps need regular maintenance due to general wear. The service interval depends on the operating conditions of the pump. Servicing a pump basically involves replacing it with a spare pump. Such intervention is preferably scheduled to minimize downtime. An unscheduled intervention can easily require downtime of a month or more; a planned intervention also takes about a month, but downtime is only 24 hr.
The intervention can be done based on several schemes:
• “Run until it breaks” (requires one month of downtime every time, assuming a complete spare pump is available)
• “Change every four years” (based on worst-case calculations, requires 24 hr of downtime)
• “Change just in time” (based on some knowledge of condition, require 24 hr of downtime).
The final method, known as condition-based maintenance, is widely used topside. In subsea production systems, this is an emerging technique made necessary by the increasing use of large rotating equipment on the seabed. For such a method to yield any real benefit, and since a subsea intervention takes about one month to perform, one needs to be able to predict the condition about one month in advance.
The value of production loss associated with a pump stop varies, but can be up to $1 million/day. Doing a planned intervention instead of unplanned can thus save about $30 million.
For a pumping system, certain Key Performance Indicators (KPIs) can be monitored and predicted, and by observing the slowly degrading performance, an estimate of remaining time to service can be made.
KEY PERFORMANCE INDICATORS
This section discusses a few observable parameters (KPIs) and how they can provide information to estimate time to service.
Lube oil consumption. In a typical subsea pumping system, the lube oil system—for cooling the high-voltage motor and lubricating the bearings—is controlled at a slight overpressure so that any leaks are from the lube oil system into the process.
The lube oil is highly viscous at seabed temperatures, such that for longer stepouts a large subsea accumulator bank is required to ensure that overpressure can be maintained for an extended time, such as after a shutdown.
There are two causes for lube oil consumption. One is due to thermal expansion and contraction of the lube oil volume inside the pump and/or motor. Every time the power level is reduced (or the pump is stopped) the lube oil cools and contracts, and additional lube oil is supplied from topside to compensate for this volume. Upon increase or pump start, the lube oil volume excess is drained to the process.
The other cause of lube oil consumption, which is the one we are interested in monitoring, is a slow leak through the seals into the process. This lube oil consumption gradually increases from a very small initial volume as the leak paths grow larger. At some stage, lube oil consumption reaches a rate at which the oil can no longer be topped off fast enough via the umbilical. Because the lube oil used is highly viscous, the allowable leak rate for a 20-mi umbilical is about 10 L/hr. If the leak rate exceeds this, lube oil overpressure cannot be maintained in the motor. All other things being equal, lube oil consumption is anticipated to increase linearly with time.
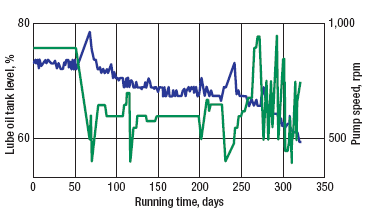
In a typical system, each subsea pump is fed from an individual topside system tank in the lube oil hydraulic power unit. Lube oil consumption can be determined by monitoring the slow drop in oil level in these tanks. In the example shown in Fig. 1, the steady decline in lube oil tank level implies the lube oil consumption through the seals. Sudden increases in lube oil tank level correspond to times when the lube oil is topped up. At times when the pump speed varies greatly, the lube oil level is observed to decline more quickly. This is as expected, since variations of speed (and therefore of power) create fluctuations in lube oil temperature and pressure, resulting in increased lube oil consumption.
 |
|
Fig. 1. Lube oil tank level (blue) and pump speed (green) are plotted over a few weeks. From the steady decline in lube oil tank level, one may infer lube oil consumption through seals.
|
|
Thus, lube oil consumption data should be measured when the pump speed is constant, to distinguish the small leaks through the seals from the much larger flows introduced by the thermal contractions for varying pump speeds.
Lube oil accumulator bank. The accumulator bank typically consists of eight 20-L accumulators. These are used after a shutdown, when the motor cools and the contracting lube oil needs to be topped off to maintain the overpressure. This accumulator bank has a large safety margin, but if, for example, half the accumulators cease operating, overpressure can no longer be guaranteed during a shutdown.
During cool-down, the lube oil contracts such that about 30 L of lube oil needs to be added to maintain the overpressure. With a long umbilical, this supply comes initially from the local accumulator, which then is recharged over time via the umbilical. The pressure out of the subsea accumulators thus drops during a cool-down, and the number of operative accumulators defines how low the pressure drops.
By observing the behavior of the accumulator bank pressure during cool-down, one can estimate how many accumulators are still functional, and when an unacceptable number have failed, one can begin to plan an intervention.
Another factor affecting this pressure drop is the initial average temperature of the lube oil at the moment the motor is stopped, relative to the ambient sea temperature. The hotter the lube oil was initially, the more it will contract, causing a larger pressure drop.
The outflow of lube oil from the accumulator bank is thus defined by the average temperature-time curve of the lube oil volume. This, in turn, is influenced by the initial average lube oil temperature (measured), the ambient sea temperature (fairly constant) and the insulation properties of the motor housing (fairly constant). The involved constants can be measured before delivery as part of integration testing.
The inflow to the accumulator bank is determined by:
• The differential pressure between the topsides and the subsea ends of the umbilical (measured)
• The distance from the topside to the seafloor (known)
• The density of the lube oil (known)
• The viscosity of the lube oil (known)
• The umbilical line size and length (known).
The pressure-time relationship for the accumulator bank is defined by the number of operative accumulators (which determines the total volume of the accumulator bank), the precharge lube oil volume (known), and the lube oil inflow and outflow.
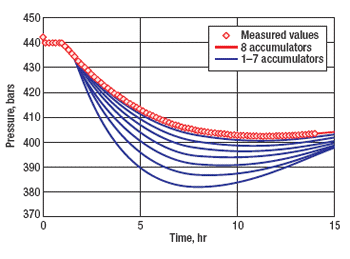
The most common failure mode for an accumulator is loss of precharge. From the information above, it is possible to simulate the expected pressure-time curve after a pump stoppage for various cases (all accumulators operational, all but one operational, all but two operational, etc.). After simulating all possible cases, it can be determined which case best fits the measured data.
Figure 2 shows the pressure in the subsea lube oil accumulator bank during a cool-down, along with the predicted pressure-time curves for the cases of one to eight accumulators being operational. The observed curve matches the curve for eight operational accumulators, which is to be expected because the example cool-down occurred soon after installation.
 |
|
Fig. 2. Pressure in a subsea system’s accumulator bank plotted with the predicted pressure/time curves for the cases of one to eight accumulators being operational.
|
|
Pump performance. Pump performance can be calculated from head, speed and power. As the pump wears, the produced head will drop (assuming that all other parameters remain constant). Simplified, the relationship among flow, head and power for a pump can be expressed as:
Shaft power = k x Flow x Head
For a positive displacement pump, the flow is directly related to rotational speed by the relationship:
Flow = k2 x Speed
Combining these results in:
Shaft power = k3 x Speed x Head, or
Head = Shaft power / (k3 x Speed)
The head is measured with pressure sensors, and power is measured topside at the Variable-Speed Drive (VSD) output. After correction for losses in the umbilical and motor, the shaft power is obtained. The speed is closely related to the output frequency of the VSD topside, so this is also known.
As the pump deteriorates over time, the head generated for a certain power and speed will also decrease. Mechanisms for this decrease include increased leakage paths internal to the pump and increased friction.
Therefore, a simple way to monitor pump performance is to adjust the constant k3 to fit available data the first time the pump is run at normal operating conditions. As the generated head decreases over time, one can then, for example, choose to replace the pump when the head decreases below 80% of its initial value.
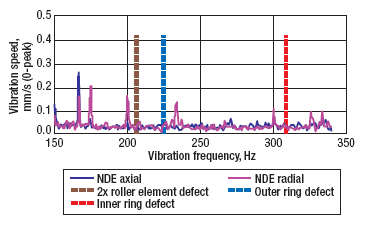
Vibration. When analyzing vibration spectra, certain frequencies indicate certain types of defects in a pumping system. One can pre-calculate at about which frequencies these signatures will occur. A result of running a pump with minor damage is shown in Fig. 3. In this example, one can observe that the Non-Driven End (NDE) radial vibration sensor is picking up vibration at about the predicted frequencies. By monitoring these over time, one can monitor how, for example, the “inner ring defect” develops over time.
 |
|
Fig. 3. Plotting pump speed vs. vibration frequency for a subsea pump being run with minor damage, one can pre-calculate at about which frequencies these signatures will occur.
|
|
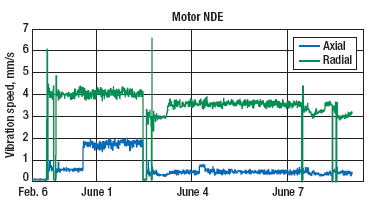
In Fig. 4, root-mean-square vibration measurements from early Frequency-Amplitude-Time (FAT) testing has been combined with recent vibration data obtained offshore. The vibration speed is shown to be nearly identical after six months of operation to its value when the pump was FAT-tested, indicating that no deterioration has occurred regarding vibration.
 |
|
Fig. 4. Plotting vibration measurements from early FAT testing (left) along with recent vibration data obtained from offshore (right) after about six months of pump run time shows that the vibration speed is nearly identical to its value when the pump was FAT-tested; that is, no deterioration has occurred regarding vibration during the first six months of operation.
|
|
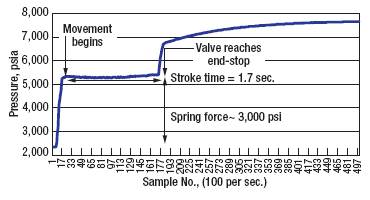
Valve actuator profiles. Whenever a subsea hydraulic actuator is operated, the subsea control module records the pressure and time during the actuator stroke. This information is available topside for analysis. By comparing this “valve profile” for a newly installed actuator with current recordings, deterioration in valve/actuator performance may be observed, Fig. 5.
 |
|
Fig. 5. The increase in hydraulic pressure indicates that the actuator is working against the spring. The valve begins moving at about 5,300 psia, the stroke seems linear with no aberrations, and the actuator reaches its end stop (spring fully compressed) when the pressure is experiencing a sharp increase to about 7,600 psia due to system pressure buildup. Stroke time is about 1.7 s, and the hydraulic pressure necessary to overcome the spring force is 3,000 psi.
|
|
Each part of the valve profile indicates important properties of the valve. Pressure required to release the valve indicates spring force, while pressure drop after release indicates corrosion. Stroke time indicates spring tension, and the pressure increase gradient upon valve closure indicates any leaks.
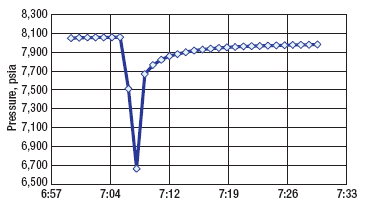
Hydraulic accumulator profiles. There are typically two hydraulic accumulators located in a subsea control module. Whenever a subsea hydraulic actuator is energized, hydraulic fluid is drawn from these accumulators. With a long umbilical, it takes several minutes to recharge these accumulators through the umbilical. By logging the pressure of the subsea accumulator and noting changes to the pressure-time curve over time, one can determine whether both, one or neither of the accumulators is operational, as well as whether one of the valves draws more or less fluid than normal during a stroke, Fig. 6.
 |
|
Fig. 6. The pressure in a subsea hydraulic accumulator bank is shown during the activation of a 4-in. valve. About 1 L of hydraulic fluid is consumed during the stroke. Pressure in the accumulator drops about 1,400 psi, and is recharged in about 15 min.
|
|
If both accumulators are lost, reliable valve operation is not possible. The subsea solenoid valves are typically hydraulically latched, and if the hydraulic supply drops too low, these will unlatch and unpredictable valve movement may occur. When one accumulator is lost, one should thus plan an intervention in the near future to replace the subsea control module before the other accumulator is also lost. 
|
THE AUTHORS
|
| |
Klas Eriksson earned an MSc degree in physics from the Royal Institute of Technology in Stockholm, Sweden, and is a Chief Engineer in the Subsea Processing and Boosting group at Aker Solutions, Norway. Mr. Eriksson’s responsibilities include advising on condition monitoring and control systems engineering. He has experience at several offshore installations in Norway and the US, including Oseberg, Draugen and Marlin. Currently, Mr. Eriksson is working on the Ormen Lange subsea compression pilot project.
|
| |
Arve Værnes is the Department Manager for control and monitoring in Subsea Processing and Boosting for Aker Solutions in Norway. He earned an MSc degree in technical cybernetics from the Norwegian Institute of Technology in 1996. He then worked in simulation software development and defense project execution for 11 years before joining Aker Solutions in September 2007.
|
| |
Gunder Homstvedt is Technology Manager in Subsea Processing and Boosting for Aker Solutions Norway. He earned an MSc degree in control engineering in 1971 and a PhD degree in oil drilling technology in 1989. He has broad experience including instrumentation, control and petroleum technology. He has been a leader of development programs for establishing new tools for downhole separation and subsea boosting technology.
|
|
| |
|


