Completion Methods
Improved fracture design avoids proppant flowback in tight gas completions
Undesirable proppant flowback after a hydraulic frac job can damage the wellhead and flowlines, and reduce productivity. A study of previous predictive models' power to assess flowback in 24 South Texas tight gas completions led to development of a new methodology.
Javier M. Canon, Scandpower Petroleum Technology, Houston; Tai T. Pham, El Paso Production Co., Houston; and Peter P. Valkó, Texas A&M University, College Station, Texas
The cleanup phase after hydraulic fracturing is often unavoidable, because under-displaced proppant will remain in the wellbore.1 During this stage, personnel and equipment are usually still in place, and any flowback can be handled easily. In contrast, proppant flowback during the well's production phase may lead to:
- Local loss of fracture conductivity, causing a reduction in hydraulic fracturing's potential benefits
- Damage to equipment (abrasion to valves, tubing, surface pipelines and other equipment).
Therefore, proppant flowback during production is highly undesirable. The most common, operational rule-of-thumb for avoiding proppant flowback focuses on maintaining the production rate below a critical value. Another available preventive action is forced closure after the treatment, attempting to trap proppant grains in the near-wellbore region, generating a more stable fracture.
It has been reported that these methods do not work all the time.2 Numerous flowback control additives have also been offered by various service firms.3 Unfortunately, evidence is lacking that they work under high formation closure stresses. Use of resin coating, in particular, has been insufficient.4
Conversely, some experimental studies have helped to delineate the mechanisms behind proppant flowback.5 However, the available prediction models rely on empirical correlations, and they may be less reliable when application conditions deviate from those used for laboratory experiments.6,7,8 This work has focused on summarizing available information and improving the models' predictive powers.
FACTORS DETERMINING PROPPANT FLOWBACK
Although no conclusive method exists to predict flowback, there is a consensus regarding the most influential parameters, as listed below.
Width. In 1992, Milton-Tayler, et al., conducted an experiment to establish different variables' relative importance in determining the likelihood of proppant flowback.5 They concluded that a narrow band of fracture width ratios (fracture width divided by mean diameter of proppant) exists, over which a proppant pack goes from stable to unstable condition. In addition, fractures wider than six grains were always unstable. This finding was corroborated by Asgian and Cundall's numerical simulation study.9 Nevertheless, stable fractures wider than six grains were reported by others.10
Closure stress. Several theoretical and experimental studies have shown the importance of closure stress since 1992.5,6,7 It is accepted7 that increased closure stress can improve frictional forces among individual grains, yielding a more stable pack.5,6,7 However, excessive closure stress can also cause proppant flowback.7 In the latter case, e.g., elevated closure stress, some proppant grains begin crushing as closure stress approaches the proppant's nominal strength. After losing mechanical integrity at a couple of locations, the granular pack's compression-induced structure is lost, and flowback begins.
Drag force. The drag force created by fluid movement depends on fluid viscosity and velocity, and on proppant pack permeability. Thick fluids will create a larger destabilizing force than less viscous ones. In addition, drag force influence depends on the closure stress experienced in the fracture.7 Basically, the cases where closure stress is extremely large or low will tend to be unstable. Limited drag force will be enough to destabilize the proppant pack. In contrast, in cases of intermediate net closure stresses, drag force is the dominating factor in the flowback phenomenon.
Proppant additives. Resin coating materials are used commonly to prevent proppant flowback. These materials help to establish a more stable pack in the fracture during downhole temperature conditions. In addition to known limitations (higher cost and the need for a specific “curation” temperature), the effect of stress cycling influences stability.11
Theoretically, a cycle represents active well production, followed by shut-in. In practice, it is not a trivial task to translate actual well history into theoretically equivalent cycles. Under high closure stresses, bonds formed by the resin coating tend to break in a lower number of cycles.
Other stabilizers have been suggested, including polymers, chopped fibers and thermoplastics. Some of these products reportedly increase the friction angle between grains, contributing to greater pack stability. However, these products' effectiveness seems to be limited to low-closure stress conditions (<6,000 psi).12,13
PREDICTION MODELS
Some models are used to predict proppant flowback occurrence in practical applications.6,7,8,14 These models comprise two general categories – empirical and theoretical.
Empirical models. Since 1996, the Stimlab consortium has conducted experiments to explain different parameters' influence in the occurrence of proppant flowback.6 Study results were used to generate the empirical Stimlab Correlation. This correlation is graphically represented in Fig. 1. The chart shows the interaction of three different variables: net closure stress in the fracture (X axis); width ratio or number of layers (curve parameter); and critical fluid velocity (Y axis). This critical velocity is a function of produced fluid and proppant properties.
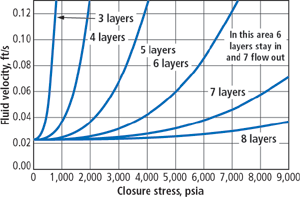 |
Fig. 1. The Stimlab Correlation chart shows the interaction of net closure stress in the fracture (X axis); width ratio or number of layers (curve parameter); and critical fluid velocity (Y axis).
|
|
The curves in Fig. 1 represent the stability limit for a given, width ratio condition in the fracture. From this plot, one can show that fracture stability improves indefinitely as closure stress increases. Consequently, the correlation is unreliable at closure stress values larger than 7,000 psi.
Proposed by Andrews and Kjorholdt, the Proppant- Free Wedge Model (PFW model) utilizes the “regions of stability” concept first suggested by the Stimlab Consortium.7 However, in this case, the authors did consider the effect of crushing at elevated closure stress values. The model, Fig. 2, considers three main terms: a) a width ratio parameter (envelopes in Fig. 2); b) a closure term (1/ C) inversely proportional to closure stress (X axis); and c) a drag term (F) proportional to the fluid drag force (Y axis).
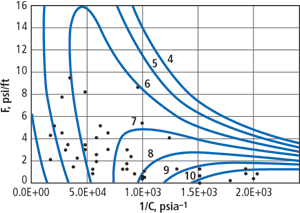 |
Fig. 2. The Proppant-Free Wedge Model looks at a width ratio parameter; a closure term inversely proportional to closure stress; and a drag term proportional to fluid drag force.
|
|
Contour lines represent the limit of stability pertaining to a certain width ratio (Wr).A combination of drag force and net closure stress (values on the Y and X axes, respectively) is represented by a point on the plot. If the point is wrapped by the envelope corresponding to the actual width ratio, the configuration is stable. Otherwise, it is unstable.
The model's curves suggest two different regions. In the first one, where closure stress is low (1/ C > 1.5 x 10⁻³), drag forces become dominant. Here, wide fractures are stable at very low drag. However, a small increase in flowrate (larger drag term) can destabilize the pack and generate flowback.
As closure stress increases (going to the left in the X axis in Fig. 2), stability increases, due to improvement of frictional forces, until a point (1/ C ~ 1.0 x 10⁻³) where it starts to have the opposite effect. In this second region, mechanical destabilization is likely. This means that the contact forces among grains become so large at some localized regions of the pack that there is a partial crushing of grains, resulting in a loss of stability.
Unfortunately, in the mechanical destabilization area of the PFW model (left-hand side in Fig. 2) the shape of the envelope curves for Wr = 6 or less, is not convincing. In this area, the original model indicates that an unstable fracture at a low drag force value can be stabilized just by a small increase in drag force, keeping all other variables constant. Evidently, this is an artifact of fitting experimental data with a polynomial expression that does not follow the law of physics.
Despite some drawbacks, this simple, empirical plot provides improved insight into the interaction among major variables responsible for the proppant flowback phenomenon.
Theoretical models. A concept often used in chemical and mechanical engineering, the “minimum fluidization velocity,” has been used in various attempts to describe the physical mechanisms behind proppant flowback.8,15
In a stationary bed of granular solids subject to penetrating gas or liquid flow, the pressure drop can be calculated by an expression called the Ergun equation.16 If fluid velocity steadily increases, a point is reached at which particles no longer remain stationary but “fluidize” under the action of liquid or gas. At this point, the pack porosity has also increased, reaching a critical value called “minimum porosity for fluidization,” emf. The fluidization velocity, vf, can be obtained from the following extrapolation of the Ergun equation for packed beds:
| |
 |
Eq. 1 |
The proppant pack is indicated stable, if the actual fluid velocity (vf) in the fracture is less than the critical value.
This equation does not account for closure stress influence, and its applicability is limited to two particular conditions. One of these is when closure stress is very low, and grains are cohesionless. The other is when the width ratio is very large and, according to the Stimlab correlation and the PFW model, fractures tend to be unstable regardless of closure stress.
SEMI-MECHANISTIC MODEL
Although some discrepancies still exist among different prediction models, there are now enough elements to integrate the most widely accepted conclusions into one single formulation. This formulation also avoids previous approaches' shortcomings, allowing a new model to be developed with the following features:17
- Interaction of net closure stress, drag force and fracture width is consistently reflected in the PFW model shape. Thus, the new model will consider the same concept of regions of stability.
- The new model has to reflect results found in experimental5,6 and theoretical studies9 regarding fracture width, i.e., wide fractures almost always are unstable.
- Because there is always a minimum velocity necessary to mobilize proppant grains out of the fracture, it is clear that the contour curves should never cross the X axis. They should tend to flatten out at a minimum value of pressure gradient, which can be calculated through the Ergun equation (Eq. 1).
- The mechanical destabilization region, per the PFW model, will be related to proppant material strength.
The stability criterion calculation starts with determination of the drag force term:
| |
 |
Eq. 2 |
where the term, WT, has a unit of psi/ft and is an exclusive function of the width ratio, Wr. It is calculated according to the following expression:
| |
 |
Eq. 3 |
As is seen from Eq. 2, WT is proportional to Fmax, so that when WT is larger, the proppant pack configuration tends to be more stable. It is also clear that WT suffers a drastic decrease when the width ratio goes from 2 to 7. For higher values, WT is small and nearly constant. This behavior has been observed in numerical models based on the Discrete Element Method.9,17
The factor ST is calculated from:
| |
 |
Eq. 4 |
Where SMAX represents the proppant's nominal strength in units of psi. For consistency, we define SMAX as the stress at which proppant permeability is reduced to 15% of its non-stressed nominal value. Some typical values for SMAX are in Table 1.
| |
Table 1. Values of closure stress |
|
| |
Proppant |
Size,
mesh |
SGP |
kf nominal,
md |
kf reduced,
md |
Nominal
strength,
psia |
|
| |
|
|
| |
Brady Sand |
12/20 |
2.65 |
1,000,000 |
150,000 |
6,500 |
|
| |
Brady Sand |
16/30 |
2.65 |
300,000 |
45,000 |
7,600 |
|
| |
Brady Sand |
20/40 |
2.65 |
300,000 |
45,000 |
6,420 |
|
| |
Hickory Sand |
12/20 |
2.65 |
1,000,000 |
150,000 |
6,550 |
|
| |
Colorado Silica Sand |
16/30 |
2.65 |
300,000 |
45,000 |
4,800 |
|
| |
Ohio Sandstone |
16/20 |
2.65 |
350,000 |
52,500 |
13,700 |
|
| |
Ohio Sandstone |
16/30 |
2.65 |
350,000 |
52,500 |
11,200 |
|
| |
Ohio Sandstone |
20/40 |
2.65 |
250,000 |
37,500 |
9,038 |
|
| |
Sinterball |
16/20 |
3.62 |
360,000 |
54,000 |
19,200 |
|
| |
Sinterball |
16/30 |
3.62 |
360,000 |
54,000 |
17,800 |
|
| |
Sinterball |
20/40 |
3.62 |
360,000 |
54,000 |
18,400 |
|
| |
Lt Wt Ceramics |
20/40 |
2.7 |
360,000 |
54,000 |
12,100 |
|
| |
IS Ceramics |
20/40 |
3.2 |
385,000 |
57,750 |
14,050 |
|
| |
HS Ceramics |
20/40 |
3.5 |
539,000 |
80,850 |
16,200 |
|
|
The term FFV (psi/ft) in Eq. 2 represents the minimum pressure gradient for mobilization of loose grains. This term correlates the drag force induced by the fluid with the proppant grain's density and size. Mobilization of a pack of loose grains starts when the drag force induced by the fluid flow overcomes the gravity force acting on a grain. As was mentioned earlier, this mechanism can be modeled with the Ergun equation. This equation was solved for the fluid velocity vf . Once this variable is obtained, the minimum pressure gradient for fluidization of loose grains, FFV, can be determined from Darcy's law:
| |
 |
Eq. 5 |
Where the fluid velocity is in ft/sec, viscosity in cP and proppant pack permeability in md. The proppant pack permeability should be reduced by a factor representing the non-Darcy part of the pressure drop. Once the maximum, stable pressure gradient, F, is determined from Eq. 2, this value can be compared to the actual pressure gradient in the fracture. If the actual pressure gradient is smaller than the maximum stable value, the fracture is stable; otherwise, it will be likely to show proppant flowback.
The envelope curves representing the different stability regions for two proppant types are in Figs. 3 and 4. Each curve corresponds to one single width ratio, i.e., number of proppant layers. This plot can be used in the following way: First, the net closure stress acting on the fracture is estimated, and the lateral pressure gradient is determined. With this information, a point is located on the plot. If the point falls inside the envelope curve corresponding to the actual fracture width ratio, the fracture will be stable. In contrast, if it falls outside this region, proppant flowback is likely to occur.
 |
Fig. 3. Stability regions, 20/40 sand proppant.
|
|
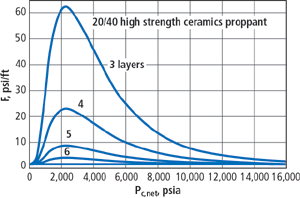 |
Fig. 4. Stability regions, 20/40 high-strength ceramics proppant.
|
|
FIELD CASE ANALYSIS
Data used for the “Post Facto” Stability Analysis correspond to 10 fractured wells in a South Texas field operated by El Paso Production Co. Most of these wells have a number of fractured intervals (stages), so that the number of treatments analyzed is 24. These wells produce mainly gas, and are characterized by low reservoir permeabilities (0.05 – 0.5 md) and high temperatures (250°F to 350°F).
These completions suffered from proppant flowback of variable severity, relative to the proppant volume injected. The proposed semi-mechanistic model was used to determine the wells' stability condition and compare the results to the relative amount of proppant actually flowed back.
General proppant properties used in the treatments, as well as the estimated fracture dimension, are included in Table 2. Stability analysis results are shown in Fig. 5. In this plot, a “stability variable” (solid line) is included. This is obtained by dividing the actual fracture width over the stable width according to the prediction model. Values of this variable larger than 1.0 indicate unstable configurations. In the same plot, a dashed line reflects the actual percentage of proppant flowed back, relative to the total volume injected.
| |
Table 2. Proppant characteristics |
|
| |
|
Proppant
|
|
| |
Well |
kf , md |
Type |
Mass, lb |
Mesh size |
SGp |
dp, in. |
|
| |
|
|
| |
Well 1 Stg. 1 |
50,000 |
Ceramax-P |
636,877 |
20/40 |
3.45 |
0.0248 |
|
| |
Well 2 |
50,000 |
Ceramax-P |
1,102,000 |
20/40 |
3.45 |
0.0260 |
|
| |
Well 4 Stg. 1 |
50,000 |
SHS Bauxite |
668,166 |
20/40 |
3.34 |
0.0248 |
|
| |
Well 4 Stg. 2 |
50,000 |
SHS Bauxite |
211,320 |
20/40 |
3.34 |
0.0248 |
|
| |
Well 5 Stg. 1 |
50,000 |
SHS Bauxite |
535,000 |
20/40 |
3.34 |
0.0248 |
|
| |
Well 5 Stg. 2 |
50,000 |
SHS Bauxite |
400,000 |
20/40 |
3.34 |
0.0248 |
|
| |
Well 6 Stg. 1 |
50,000 |
Sintered Bauxite |
469,540 |
18/30 |
3.34 |
0.0306 |
|
| |
Well 6 Stg. 2 |
50,000 |
Sintered Bauxite |
544,000 |
18/30 |
3.34 |
0.0306 |
|
| |
Well 6 Stg. 3 |
50,000 |
Sintered Bauxite |
263,271 |
18/30 |
3.34 |
0.0306 |
|
| |
Well 6 Stg. 4 |
50,000 |
Sintered Bauxite |
190,500 |
18/30 |
3.34 |
0.0306 |
|
| |
Well 7 Stg. 1 |
50,000 |
Sintered Bauxite |
587,500 |
20/40 |
3.34 |
0.0248 |
|
| |
Well 7 Stg. 2 |
50,000 |
Sintered Bauxite |
381,300 |
16/30 |
3.34 |
0.0351 |
|
| |
Well 7 Stg. 3 |
50,000 |
Sintered Bauxite |
284,267 |
20/40 |
3.34 |
0.0248 |
|
| |
Well 8 Stg. 1 |
50,000 |
Sintered Bauxite |
359,088 |
20/40 |
3.34 |
0.0248 |
|
| |
Well 8 Stg. 3 |
50,000 |
Sintered Bauxite |
530,120 |
20/40 |
3.34 |
0.0248 |
|
| |
Well 8 Stg. 4 |
50,000 |
Sintered Bauxite |
165,404 |
20/40 |
3.34 |
0.0248 |
|
| |
Well 9 Stg. 1 |
50,000 |
Sintered Ball |
507,700 |
16/30 |
3.34 |
0.0351 |
|
| |
Well 9 Stg. 2 |
50,000 |
Sintered Ball |
678,550 |
16/30 |
3.34 |
0.0351 |
|
| |
Well 9 Stg. 3 |
50,000 |
Sintered Ball |
640,310 |
16/30 |
3.34 |
0.0351 |
|
| |
Well 9 Stg. 4 |
50,000 |
Sintered Ball |
837,810 |
16/30 |
3.34 |
0.0351 |
|
| |
Well 10 Stg. 1 |
50,000 |
Sintered Bauxite |
676,500 |
20/40 |
3.34 |
0.0248 |
|
| |
Well 10 Stg. 2 |
50,000 |
Sintered Bauxite |
445,500 |
20/40 |
3.34 |
0.0248 |
|
|
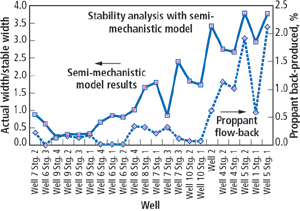 |
Fig. 5. Stability analysis results, featuring a stability variable (solid line).
|
|
As seen, some completions, i.e., Well 4 Stg. 2, Well 5 Stg. 2, are highly unstable according to the stability analysis. These same wells produced the largest relative amounts of proppant. On the other hand, for the wells that reported the lowest relative volumes flowed-back, i.e., Well 9 Stg. 4, Well 6 Stg. 1, the model predicted stable configurations.
According to the model, most unstable fractures will not achieve stability, even if the production rate (and consequently the pressure gradient) is reduced to a minimal value. In those cases, stability can be achieved only by design means (reducing the targeted fracture width).
Overall, the results corroborate the simple rule first documented by Milton-Tayler, et al.,5 that fractures wider than six particle diameters are inherently unstable. According to the semi-mechanistic model, the use of a high-strength proppant does not alter this behavior drastically.
Effect on well productivity. A second series of calculations was performed for each completion, focusing on proppant flowback's detrimental effect on treated wells' productivity. Proppant production triggers choked-fracture skin.18,19 This effect refers to the formation of a zone in the fracture near the wellbore, where the fracture width is reduced.
In Fig. 6, an ideal dimensionless productivity index is denoted by Jd,id (calculated without considering the proppant flowback-caused width reduction). The second, productivity, Jd,ck denotes the actual productivity, after the proppant flowback causes the choke. Finally, Jd,sta, denotes the productivity obtained with less proppant but satisfying the stability criterion (and hence avoiding detrimental proppant flowback.)
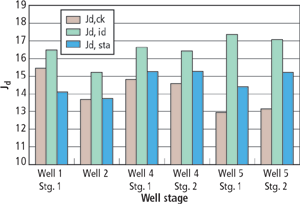 |
Fig. 6. Lower amounts of proppant will create stable fractures and more productive wells than results obtained from the actual treatment.
|
|
As shown in Fig. 6, a lower amount of proppant would have created a stable fracture and a more productive well than the actual treatment. For instance, in Well 5 Stg. 1 and 2, proppant flowback was responsible for severely reducing the wells' productivity. In those cases, the proposed fractures would have been more convenient (and would have also saved significant additional operational costs stemming from proppant back-production).
These results confirm the benefits of including a “stability criterion” in the design phase of a fracturing treatment. (This does not exclude the use of other means, such as proppant flowback agents and/or posing operational limits on production rates, but these are considered secondary.)
Proppant flowback with time. Additional analysis considered a specific well's flowback history. Well 11 is a gas completion producing from two formations independently treated (Stgs. 1 and 2). Resin-coated bauxite was used as proppant. After the treatments, very small amounts of proppant were produced during several weeks online.
From the calculations using the semi-mechanistic model, it was observed that Stg. 1 was unstable and would flow proppant at the given conditions. However, the well did not produce significant amounts of proppant, and this could be attributed to the resin holding the proppant grains together, preventing flowback at the initial conditions.
After a three-week proppant-free period, however, when the flowing wellhead pressure (FWHP) was gradually reduced to 3,200 psi, proppant flowback started. Proppant pack stability was evaluated using the semi-mechanistic model for the moment of time right before the well began flowing proppant back ( t1 is approximately 19 days).
Results of the stability analysis for t1 are shown in Fig. 7. They qualitatively explain why the propped fracture turned out unstable. For a more detailed analysis, one should consider the additional laboratory observation, that the resin detaches from the proppant at net closure of 5,500 to 6,500 psi.4 Also, at this moment, the FBHP was approaching the reservoir fluid's apparent dew point. The presence of condensate causes a large increase in the drag force term. Hence, it is not surprising that the proppant pack became unstable. It is anticipated that proppant will flow back until a stable width ratio is reached near the well.
 |
Fig. 7. In the post-proppant flowback period, points are displaced by changes in net closure pressure and drag force.
|
|
Indeed, the proppant flowback period lasted about a day. The situation corresponding to the period after the proppant flowback (time point t2, about 21 days) is also depicted in Fig. 7. In the semi-mechanistic plot, there is a displacement of the points as a result of changes in net closure pressure and drag force. In addition, from simple material balance of produced proppant and volumetric calculations, one can estimate the width ratio in these fractures' choke regions. If one assumes that, in the choked region, relative width is reduced to about 3.5, these two completions will be stable at time t2 according to the model.
While the resin-coated material used in the fracture might have helped to delay proppant flowback, the pack ultimately failed. Intermittent proppant production then resulted in a reduced width in the choke region. The reduced width “brought back” the well into the stable region. It is anticipated that an additional decrease in FBHP will make the point unstable again. Indeed, similar cyclic proppant flowback and natural healing phenomena have been observed in several neighboring wells. 
| |
NOMENCLATURE |
|
|
a ' |
|
Constant for the semi-mechanistic model = 7.7172 |
|
|
1/ C |
|
Closure term in the PFW model, psia -1 |
|
|
dp |
|
Mean grain diameter of proppant, in. |
|
|
F |
|
Drag term, psi/ft |
|
|
Factual |
|
Actual pressure gradient in the fracture, psi/ft |
|
|
FFV |
|
Minimum pressure gradient to destabilize loose proppant grains, psi/ft |
|
|
Fsta |
|
Maximum stable pressure gradient in the semi-mechanistic model, psi/ft |
|
|
g |
|
Acceleration of gravity: 32.2 ft/sec 2 |
|
|
Jd,id |
|
Ideal dimensionless productivity index |
|
|
Jd,ck |
|
Dimensionless productivity index after choked fracture effect |
|
|
Jd,sta |
|
Best achievable dimensionless productivity index |
|
|
kf |
|
Proppant pack permeability, md |
|
|
Pc,net |
|
Net closure pressure, psia |
|
|
SGp |
|
Specific gravity of proppant |
|
|
SMAX |
|
Maximum strength of proppant, psia |
|
|
vf |
|
Minimum fluidization velocity, ft/s |
|
|
Wr |
|
Width ratio |
|
|
WT |
|
Width term in the semi-mechanistic model |
|
|
Greek Letter Variables
|
|
|
emf |
|
Mean dense phase voidage at minimum fluidization |
|
|
µf |
|
Fluid viscosity, cp |
|
|
rf |
|
Fluid density, lb/ft3 |
|
|
rp |
|
Particle density, lb/ft3 |
|
|
fs |
|
Shape factor for granular particles in the Ergun equation |
|
LITERATURE CITED
1 NSI Technologies (eds.), Hydraulic Fracturing,Tulsa, Oklahoma, 1987, vol. 3.
2 Gidley J.L., S. A. Holditch, D. E. Nierode and R. W. Veath, “Recent advances in hydraulic fracturing,” Monograph Series, SPE, Richardson, Texas, 1989, vol. 12, pp. 210 – 222.
3 Stephenson, C.J., A. R. Rickards and H. D. Brannon, “Increased resistance to proppant flowback by adding deformable particles to proppant packs tested in laboratory,” SPE paper 56593, 1999.
4 Frac Tech Ltd., Technology Facility for Reservoir Development & Optimization, “Proppant flowback report,” June 2002.
5 Milton-Tayler, D., C. Stephenson and M. Asgian, “Factors affecting the stability of proppant in propped fractures: Results of a laboratory study,” SPE paper 24821, 1992.
6 Stimlab Consortium Proppant Flowback Reports, 1996 – 2002.
7 Andrews, J.S. and H. Kjørholt, “Rock mechanical principles help predict proppant flowback from hydraulic fractures,” SPE paper 47382, 1998.
8 Parker, M., J. Weaver, and D. Van Batenburg, “Understanding proppant flowback,” SPE paper 56726, 1999.
9 Asgian, M.I. and P. A. Cundall, “The mechanical stability of propped hydraulic fractures,” SPE paper 28510, 1994.
10 Hall, C.D. and W. H. Harrisberger, “Stability of sand arches: A key to sand control,” JPT, July 1970.
11 Vreeburg, R. J., L. P. Roodhart and D. R. Davies, “Proppant back production during hydraulic fracturing: A new failure mechanism for resin-coated proppants,” SPE paper 27382, 1994.
12 Nguyen, P., et al., “Proppant flowback control additives,” SPE paper 36689, 1996.
13 Nguyen, P. D., et al., “Surface-modification system for fracture-conductivity enhancement,” SPE paper 48897, 1998.
14 Patankar, N.A., D.D. Joseph., J. Wang, R. D. Barree, M. Conway and M. Asadi, “Power law correlations for sediment transport in pressure-driven channel flows,” International Journal of Multiphase Flow 28, 2002, pp. 1269 – 1292.
15 Sparlin, D.D. and R. W. Hagen, “Proppant selection for fracturing and sand control,” World Oil, January 1995, pp. 37 – 40.
16 W. L. McCabe and J.C. Smith (eds.), Unit operations of chemical engineering, McGraw-Hill Book Co. Inc., New York, 1976, pp. 146 – 169.
17 Canon, J. M., “Predicting proppant flowback from fracture-stimulated wells,” Master of Science Thesis, Texas A&M University, 2003.
18 Romero D. J., P.P. Valkó and M. J. Economides, “The optimization of the productivity index and the fracture geometry of a stimulated well with fracture face and choke skins,” SPE paper 73758, 2002.
19 Canon, J.M., D. J. Romero, T. T. Pham and P. P. Valkó, “Avoiding proppant flowback in tight-gas completions with improved fracture design,” SPE paper 84310, 2003.
THE AUTHORS
|
 |
Javier M. Canon (jmc@ scandpower.com) works for Scandpower Petroleum Technology in Houston. He holds a BSc degree from Universidad de America in Bogota, Colombia, and an MSc degree from Texas A&M University, both in petroleum engineering.
|
 |
Tai Pham (tai.pham@ elpaso.com) is chief reservoir engineer at El Paso Production Co, where he is involved in well performance evaluations and integrated reservoir studies. Prior to joining El Paso, he worked for Chevron USA as a petroleum engineer and at ERCO Petroleum Services as a consultant. He holds a BS degree from the University of Texas and an MS degree from the University of Houston, both in petroleum engineering.
|
 |
Dr. Peter P. Valkó (p-valko@tamu.edu) is an associate professor of petroleum engineering at Texas A&M University. He holds BS and MS degrees from Veszprém University (Hungary) and PhD from the Institute of Catalysis, Novosibirsk (Russia).
|
|


