Improving fracture design in tight gas reservoirs using new slim dipole tool
Current fracture models can define some of the geometric complexity of hydraulic fractures resulting from variables such as lithology, rock mechanical properties and stress magnitude and direction. Nevertheless, verification of the achieved fracture geometry is still required to apply the models with confidence.
Acoustic-based techniques are now being used to better understand specific features of the fracture geometry and to optimize treatment for each stage. The data also can determine if the fracture geometry performed as predicted by the model, or if further adjustments are required to refine the model.
Nowadays, operators are using a differential cased-hole sonic anisotropy model to compare acoustic data acquired before, and after, a hydraulic fracturing job. Analysis of the data defines the open fracture intervals and enables operators to accurately estimate the hydraulic propped fracture height. However, the use of this technique has been restricted to larger casing diameters.
APPLICATION CHALLENGES
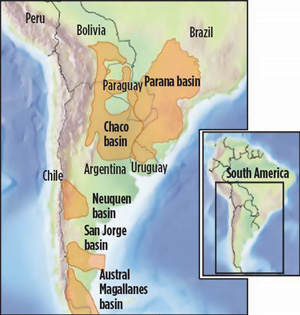
The Lajas formation, in Argentina’s Neuquén basin, is a tight reservoir that requires hydraulic fracture stimulation to be economically feasible, Fig 1. In 2000, operators began applying large-scale fracture treatments to liberate commercial quantities of hydrocarbons from the Lajas, but with only limited success. The success of these jobs depends on several factors, including the formation geology, petrophysical properties, mechanical properties and field stress distribution.
Characterizing fracture geometry is difficult, not only because of the reservoir’s inherent complexity, but also from limitations of the different measurement techniques. In Argentina, fracture height analysis, using acoustic measurements, has proven to be a powerful resource to improve hydraulic fracturing strategies. However, without a slim-diameter dipole tool, the technique could not be applied in small-diameter cased holes, which are common in the unconventional market.
GEOLOGICAL COMPLEXITY
The Lajas formation is part of the Cuyo group, which corresponds to the first widespread marine sedimentation in the Neuquén basin. The Cuyo formations are important hydrocarbon-bearing sediments and have been targeted since exploration began in the region.
The group consists of the shaly marine deposits of the Los Molles formation with isolated turbidite intervals, which are overlaid by sandstones and conglomerates deposited from shelf marine to continental environments. The Lajas formation consists of intercalated sandstones and mudstones of variable thickness. Petrographically, the Lajas formation is composed of medium-to-fine-grained feldspathic litharenitic and intervals of coarse-to-very coarse-grained lithic sandstone with poor-to-moderate sorting.
Pre-existing morphological features, such as the Huincul high and the overburden load, are the main controls for the petrophysical properties of the Lajas formation in the Neuquén basin. Formation porosity ranges from 7 to 10 p.u., with permeability between 0.1 and 0.001 mD. The clays, as analyzed by X-ray diffraction, range from 5% to 12%, mainly corresponding to illite and chlorite.
FRACTURE GEOMETRY EVALUATION
Understanding hydraulic fracture geometry is critical during treatment execution and for subsequent design improvement. Methods for evaluating fracture geometry during, and after, fracture creation are classified into near-wellbore and far-field methods, based on the depth of investigation (DOI) of the tool used to collect data for performing the evaluation, Fig. 2.
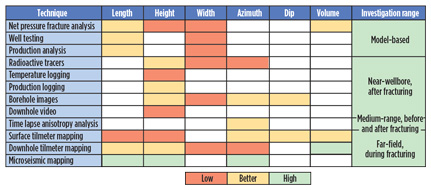
Near-wellbore evaluation methods, such as radioactive tracers and temperature and production logs, are used widely to correlate the hydraulic fracture height and obtain information regarding proppant location. However, the very low DOI of these measurements means that the results may not represent what is occurring beyond the immediate borehole region. Furthermore, these measurements are time-dependent, which implies that the logging must be performed immediately after hydraulic fracturing operations to be representative.
Far-field evaluation methods, which are performed during the stimulation operation, are preferred for determining fracture geometry, because they provide reliable information about fracture height, length, azimuth and symmetry. The disadvantages are that they can be limited by operational features, such as the distance between the monitor and the treated well, which velocity model is employed, or the reservoir fluid type.
To bridge the gap between the near and far methods for evaluating hydraulic fracture geometry (mainly height), time-lapse acoustic anisotropy analysis was introduced as a “mid-field” method, with data acquired both before and after hydraulic fracturing of the Lajas formation.
SONIC ACQUISITION IN CASED HOLE
The reliability and quality of cased hole sonic data have historically been a concern. Traditionally conducted in open hole, the existing techniques accurately measure the compressional and shear formation slownesses. However, in cased hole, the complexity of the recorded waveforms is increased by the addition of propagating modes, including casing signals, which can vary depending on cement bonding conditions. Generally, the quality of sonic data acquired from behind casing is mainly influenced by cement bond quality and formation velocity.
Because unconventional formations are usually hard rocks, which are fast formations, it is the bonding conditions that mainly affect the compressional slowness quality but not that of the dipole shear, which is typically of good quality. This means that engineers can manage the processing and quality control to correctly measure the dipole fast and slow shear in cased holes.
The resulting fast shear can be used to help estimate the missing compressional slowness along poorly bonded intervals. Depending on the bonding conditions, a combination of the fast shear and petrophysical evaluation from the spectroscopy tool can be used to reconstruct the compressional values, using a rock physics model.
ANISOTROPY ANALYSIS FROM WAVEFORM DISPERSION
The dipole flexural waves of acoustic tools are dispersive waves, with their behavior influenced by the capabilities of the logging tool, borehole size, mud density and velocity, and the formation properties (bulk density, compressional and shear velocity). Analyzing shear slowness variations in the frequency domain and inverting discrete slowness values over a wide frequency band provides different DOIs. For low frequencies, a DOI that ranges from two to three times the borehole diameter can be achieved, hence the mid-field categorization.
Shear waves propagate through rocks with different velocities in different directions. This phenomenon is called acoustic anisotropy, and it can be caused by mechanisms, such as aligned fractures, layering or stress imbalance. Azimuthal acoustic anisotropy, orthogonal to the tool direction, can be measured through logging and processing that identifies and rotates the slow and fast shear components.
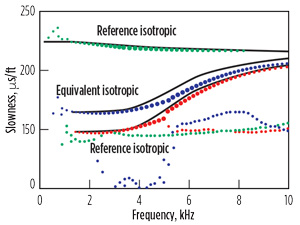
Analysis of the dipole flexural dispersive data enables identifying the acoustic anisotropy mechanisms, using only the sonic measurements. For example, for hydraulically induced fractures, long axial fractures introduce an effectively TIH anisotropic signature (Fig. 3) in terms of nonintersecting cross-dipole dispersions.
Thus, the differential cased-hole sonic anisotropy (DCHSA) technique was developed using Sonic Scanner* acoustic scanning platform data to determine hydraulic fracture height through time-lapse comparison of anisotropy results from before and after hydraulic fracturing. DCHSA determines hydraulic fracture height, using one of two indicators:
- An increase in the difference between the minimum and maximum energy and shear slowness anisotropy. When the rock is hydraulically fractured, the height observed post-fracturing is represented by an increase in this anisotropy indicator;
- Comparison of fast shear pre-fracture vs. fast shear post-fracture and of slow shear pre-fracture vs. slow shear post-fracture, for which the fracture height is the observed shear slowness difference greater than 1%.
When a significant increment of shear anisotropy exists, and the data are acquired with a gyro or a magnetometer—depending on the well deviation—by knowing the relative bearing and position of the tool with respect to north, the height of the propped hydraulic fracture and the preferred fracture plane direction of the hydraulic fracture or fractures created can be obtained.
As previously mentioned, in comparison with near-wellbore methods, DCHSA can be considered a mid-field technique. As such, it provides sufficient DOI to assess fracture growth in the formation without any time dependency on when the technique must be applied after hydraulic fracturing. Although this technique has been applied successfully in the Neuquén basin for tight and shale gas reservoirs, its application was limited by the lack of slim acoustic tools for the small-diameter cased holes typical to unconventional wells.
THRUBIT DIPOLE THROUGH-THE-BIT ACOUSTIC SERVICE
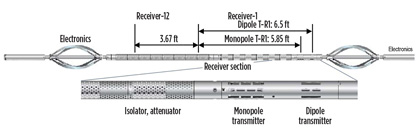
To apply the benefits of a detailed sonic investigation in smaller boreholes, a new-generation slimhole tool has been developed for monopole and cross-dipole sonic logging, Fig. 4. The entire optimized structure of ThruBit Dipole* through-the-bit acoustic service is contained in a 2 1/8-in.-OD housing.
The high quality of the dipole measurements obtained with ThruBit Dipole service’s wide-band dipole sources has been confirmed in a variety of borehole and formation conditions, including cased-hole wells. By extending the application of cased-hole sonic anisotropy to the logging of small casing diameters, ThruBit Dipole service enables comparing post-fracture slim dipole log data with a pre-fracture slim dipole log or open-hole log data from the full-size Sonic Scanner acoustic scanning platform.
The tool’s sophisticated sensor section provides fine spatial and frequency sampling for dispersive modes. It has four azimuthal receiver strips, each hosting 12 sensors, spaced every 4 in., which ensures spatial aliasing is not an issue for the sonic processing. Additionally, the collocation of two orthogonal dipole transmitters in the tool supports anisotropy processing without concerns for depth misalignment between the two dipole firings.
3D modeling verification. Research engineers used 3D finite-difference modeling to test component shapes and dimensions, to fully understand and optimize tool response. Unlike other logging technologies, a sonic logging tool is an integrated system that must be evaluated and quantified as such. For example, the geometry, density, compressibility and flexibility of the tool alter the propagation of the measured borehole modes.
Modeling showed that the tool’s novel design largely attenuated the unwanted tool flexural wave in the isolator section, to not interfere with the borehole flexural wave in the receiver section for the frequency band from 2 to 6 kHz. The mechanical strength is maximized without affecting the quality of the monopole and dipole measurements in the fast formations common in unconventional reservoirs.
PRE-FRACTURE DATA: OPEN VS CASED-HOLE ACQUISITION
Application of the mid-field DCHSA technique requires data consistency between the acoustic logging runs before, and after, the hydraulic fracturing job. In this study, the consistency of pre-fracturing data acquisition, using the full-size Sonic Scanner acoustic scanning platform and ThruBit Dipole through-the-bit acoustic service tool, was evaluated. This required performing an additional cased hole pre-fracturing run with ThruBit Dipole service.
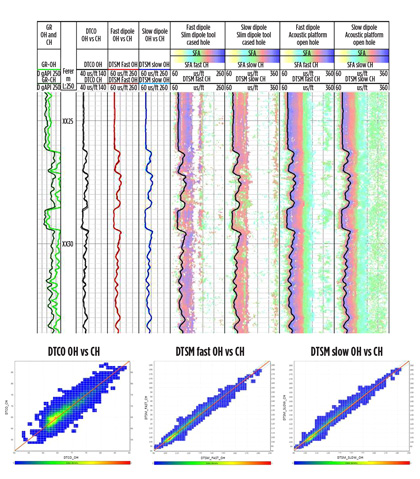
Theoretically, the dipole signal should not be highly affected by casing presence or the well’s bonding conditions. The Lajas formation is acoustically considered a fast formation, with compressional and shear slownesses ranging from 40 to 50 us/ft and 90 to 110 us/ft, respectively. However, for this type of formation, the monopole compressional slowness measurement through casing may be difficult to measure and depends heavily on well bonding. Dipole mode in cased hole makes it possible to measure the shear formation slowness in almost all situations, if the tool is perfectly centralized. The comparison in Fig. 5 shows high consistency for the two runs, with both the monopole compressional and dipole shear signals in good agreement. Thus, whether a well is logged pre-fracturing with the full-size Sonic Scanner platform or the slim ThruBit Dipole service, the data consistency with post-fracturing Thrubit Dipole acquisition enables use of the DCHSA technique.
FRACTURE HEIGHT INTERPRETATION
Results of propped fracture height evaluation using the DCHSA technique are shown for three cases. The method was applied using an open-hole run with the Sonic Scanner platform before the hydraulic fracture, and a cased-hole run with ThruBit Dipole service after the hydraulic fracture job. An additional pre-fracturing cased-hole run with the ThruBit Dipole tool was performed for the first two cases, to demonstrate
data consistency.
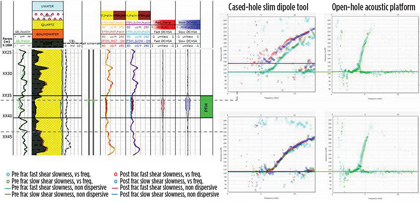
Case study 1. The DCHSA technique was applied for a single perforating interval, in a sand with shaly layers, which are considered potential barriers, Fig. 6. Before the hydraulic fracturing operation, log data from ThruBit Dipole service and the Sonic Scanner platform were acquired. Analysis of these data with the post-fracturing log acquired with ThruBit Dipole service shows a slowness increment for part of the sand interval, which is interpreted as the propped fracture height and indicates that the hydraulic fracture was partially stimulated. Dispersion plots at different depths show isotropic behavior before, and after, fracture. Along the open hydraulic fracture, an increase of slowness is observed for both fast and slow modes.
Case study 2. This case study shows the DCHSA technique applied for a stage with three perforation intervals, Fig. 7. As for case study 1, pre-fracturing log data were acquired with both ThruBit Dipole service and the Sonic Scanner platform. The results show that this fracture was partially successful. In the two upper intervals, perforating stimulated the formation and developed fracture height, with a potential barrier present between them. However, the lowest perforation interval shows no fracture height and hence, stimulation of this interval was not successful, as confirmed by additional information showing no production at this depth.
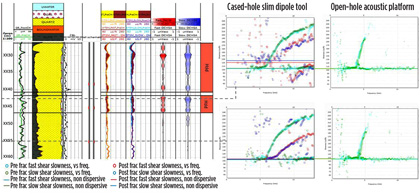
The results obtained from this analysis enabled the operator to redefine the hydraulic fracture strategy to more effectively stimulate this interval. A dispersion plot at different depths shows isotropic behavior both before, and after, fracture.
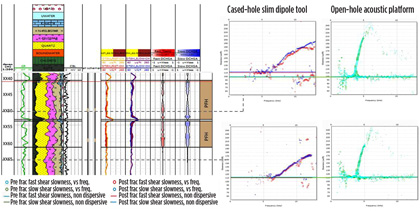
Case study 3. The third case study shows the DCHSA technique applied in a stage with two perforation intervals, Fig. 8. Before fracturing, open-hole log data were obtained only with the Sonic Scanner platform. Fracture height results show successful stimulation for both perforation intervals. Although the analysis was conducted with pre-fracturing open-hole data and post-fracturing cased-hole data from different tools, consistencies between the two logging runs are seen along the non-fractured intervals.
THE VALUE OF A SLIM TOOL
The new-generation slim dipole sonic tool successfully extends application of the DCHSA technique to small-diameter cased wells. Consistencies in the comparison of open-hole logs and cased-hole logs using a full-size Sonic Scanner platform and the slim ThruBit Dipole service, respectively, demonstrate the feasibility of the technique and its flexibility for combining different tools and conditions.
Case study analysis documents that the propped fracture height results provided valuable information regarding the success of the perforation intervals in each fracture stage. Interpretation of the results was key in revising and redefining the hydraulic fracture strategy to optimize well completion costs in the Lajas tight gas reservoir. The results clearly demonstrate that the new slim ThruBit Dipole through-the-bit acoustic service delivers operator value as a viable fracture optimization tool. ![]()
*Mark of Schlumberger
ACKNOWLEDGMENTS
This article was adapted from URTeC paper 2695456, which was presented at the Unconventional Resources Technology Conference, held in Austin, Texas, July 24-26, 2017.

