Industry at a Glance
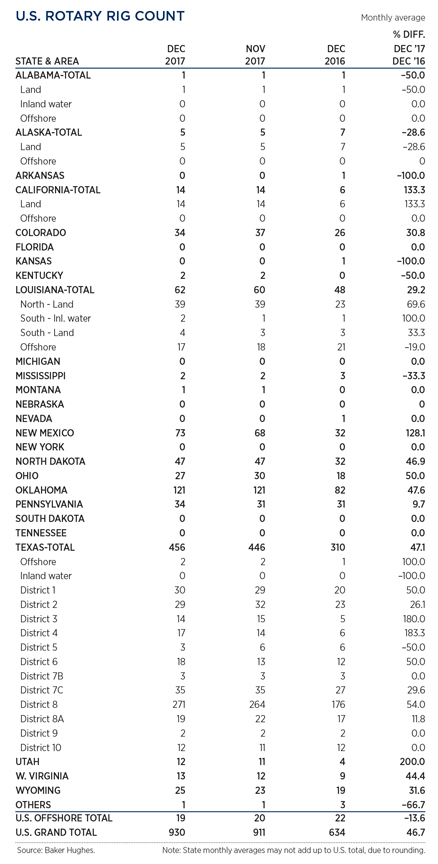
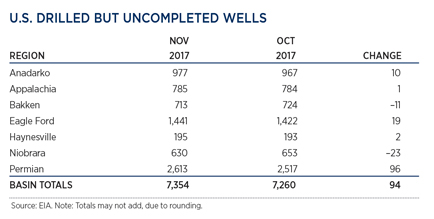
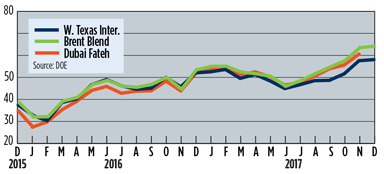
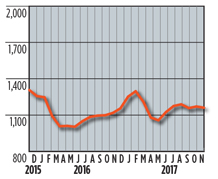
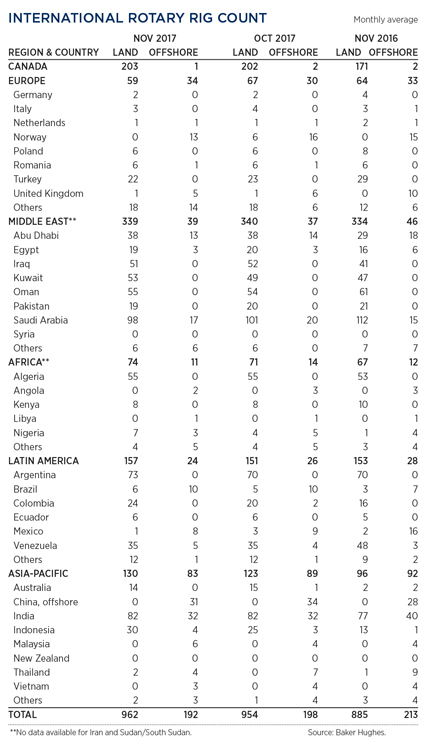
Crude climbed to its highest level in two-and-a-half years after an EIA report showed that U.S. stockpiles fell for a seventh consecutive week. WTI futures rose almost 1%, while spot prices in December hovered around $58/bbl. Brent traded at a $6/bbl premium to WTI. Prices began a run-up to $60 at year’s end, supported by unrest in Iran. The Saudi-Russian cuts continued to prove effective, but ample worldwide supply and the U.S. shale-OPEC tug-of-war capped further price gains. The U.S. rig count averaged 930 units in December, just 19 more than tallied in November, despite the spike in benchmark prices. The DUC portfolio gained 94 wells, with the exception of the Niobrara and Bakken shales, which declined 23 and 11, respectively. International activity averaged 1,154 rigs in November, two more than the previous month. ![]()
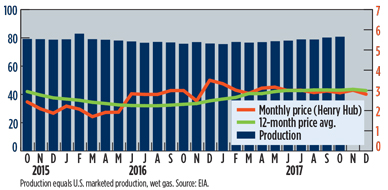
U.S. GAS PRICES ($/MCF) AND PRODUCTION (BCFD) GRAPH
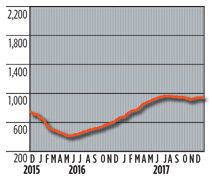
U.S. ROTARY DRILLING RIGS GRAPH
U.S. ROTARY DRILLING RIGS TABLE
U.S. DRILLED BUT UNCOMPLETED WELLS
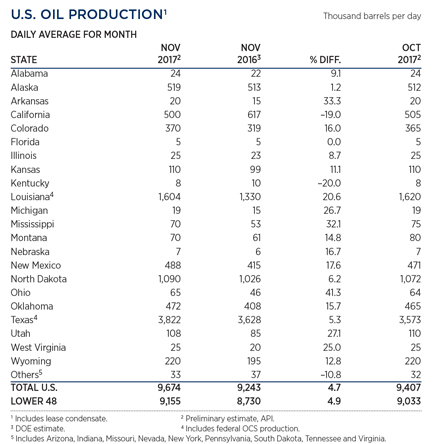
U.S. OIL PRODUCTION TABLE
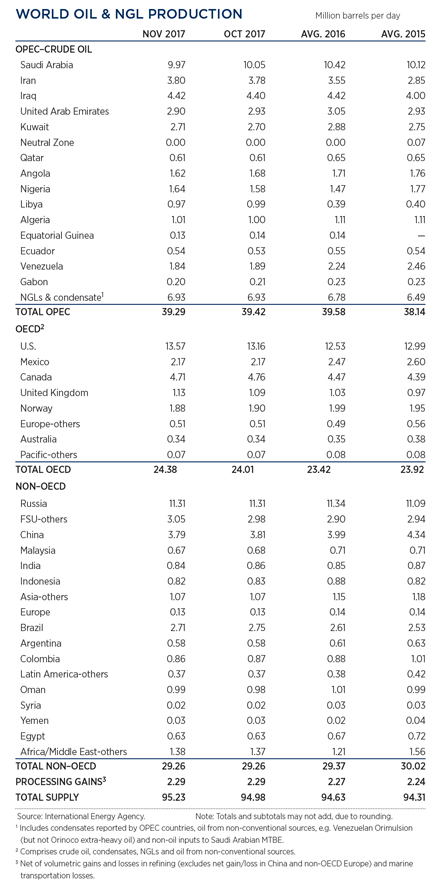
WORLD OIL PRODUCTION TABLE
SELECTED WORLD OIL PRICES GRAPH
INTERNATIONAL ROTARY RIG GRAPH
INTERNATIONAL ROTARY RIG TABLE
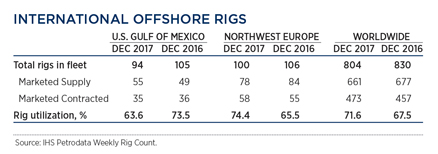
INTERNATIONAL OFFSHORE RIGS TABLE

- Management issues- Dallas Fed: Activity sees modest growth; outlook improves, but cost increases continue (October 2023)
- Industry at a glance (June 2023)
- Industry at a glance (May 2023)
- Management issues- Dallas Fed: Oil and gas expansion stalls amid surging costs and worsening outlooks (May 2023)
- Executive viewpoint (April 2023)
- Global offshore market is on the upswing (April 2023)

