Industry at a Glance
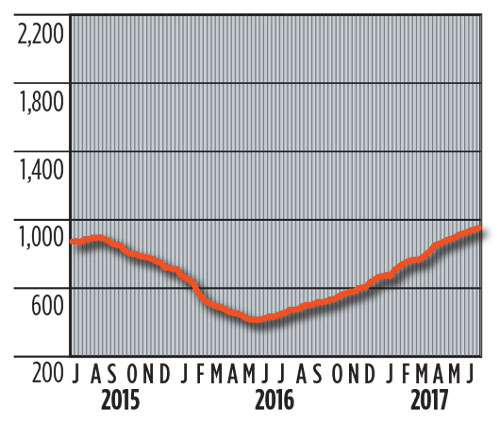
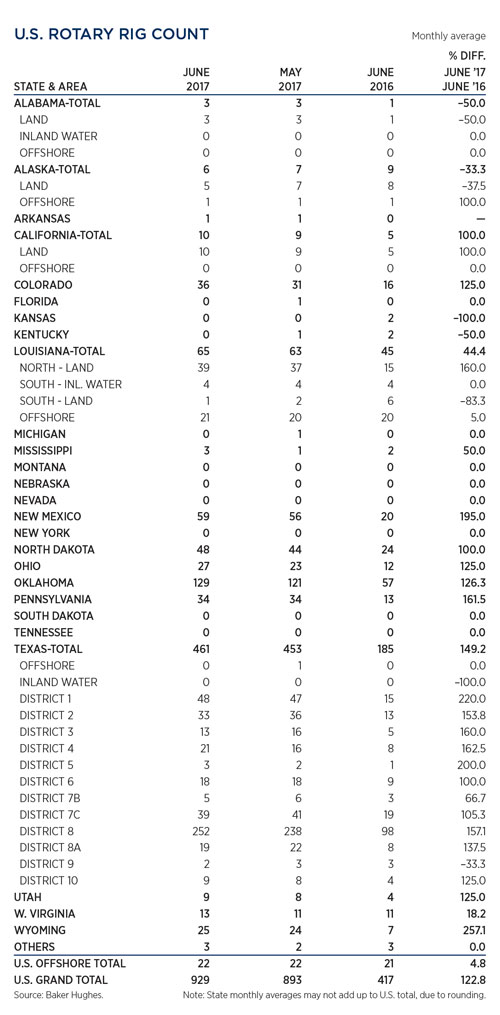
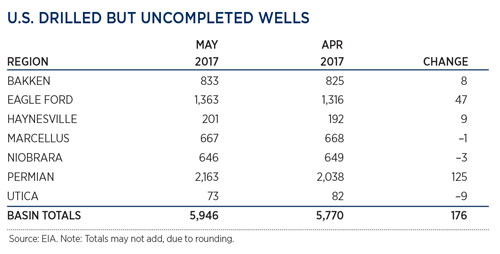
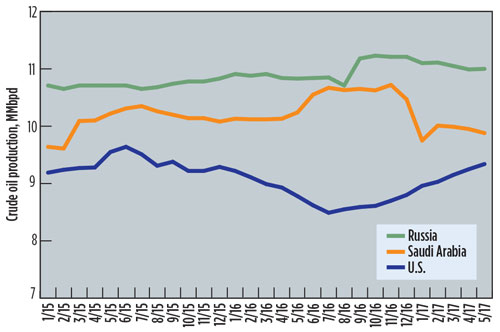
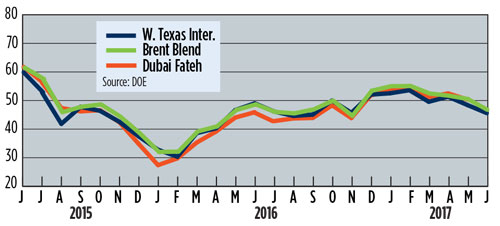
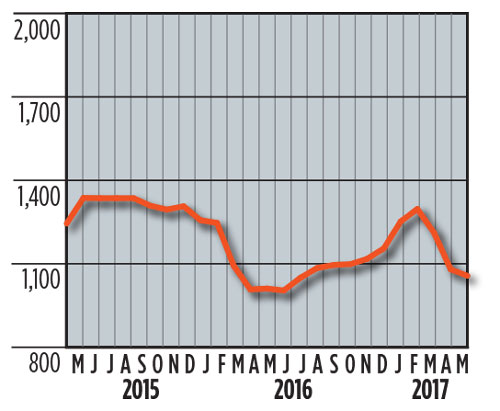
Despite OPEC’s nine-month, output cut extension, the cartel’s control over global crude markets continued to wane, with record-high Russian production and increased U.S. supply offsetting the cutbacks. Although reduced oil imports to the U.S. have drawn inventory down by 26 MMbbl since March, stockpiled product remained 100 MMbbl above the five-year average. The unrelenting supply and storage excess put downward pressure on benchmarks, and prices declined for five straight weeks, averaging $46.15/bbl in June, 6.6% less than in May. In the U.S., drillers added rigs for a 23rd straight week, the longest stretch in three decades, pushing the average tally up to 929 in June. Onshore activity increased the DUC backlog by 176 wells, with 71% of the increase occurring in the Permian basin. International activity was down 12 rigs, averaging 1,050 active units in May. ![]()
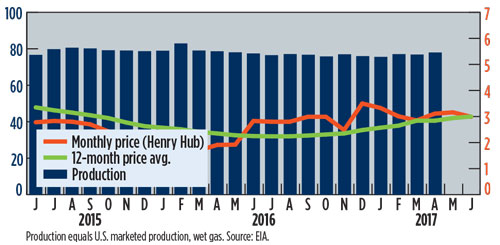
U.S. GAS PRICES ($/MCF) AND PRODUCTION (BCFD) GRAPH
U.S. ROTARY DRILLING RIGS GRAPH
U.S. ROTARY DRILLING RIGS TABLE
U.S. DRILLED BUT UNCOMPLETED WELLS
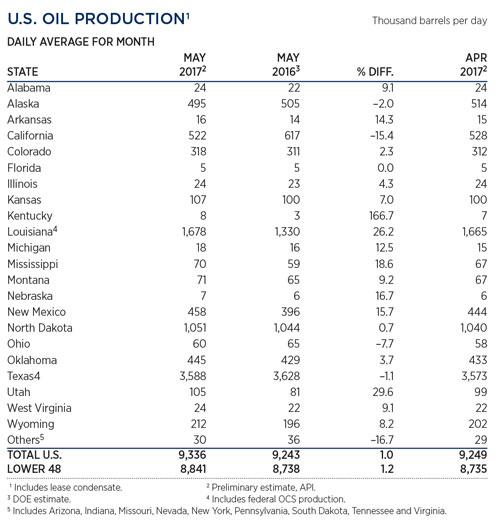
U.S. OIL PRODUCTION TABLE
WORLD CRUDE OIL PRODUCTION, TOP THREE PRODUCERS
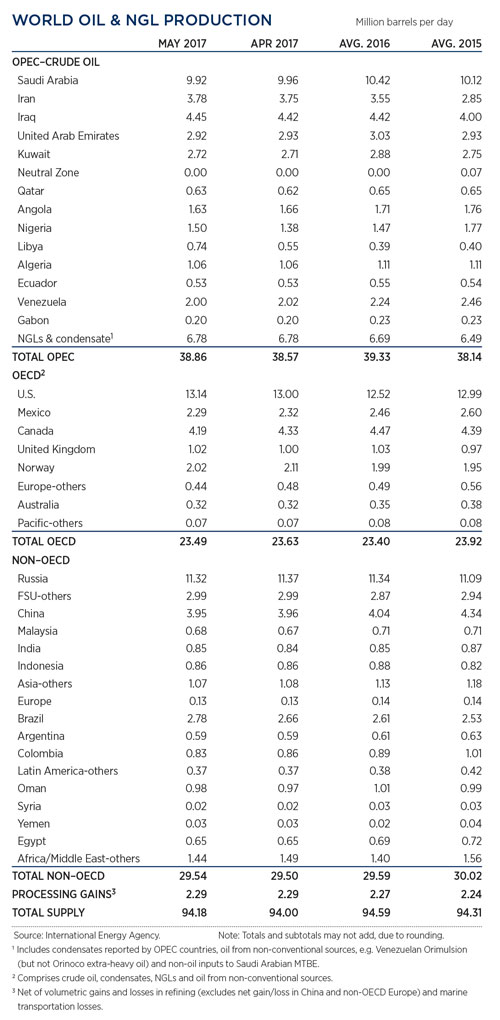
WORLD OIL PRODUCTION TABLE
SELECTED WORLD OIL PRICES GRAPH
INTERNATIONAL ROTARY RIG GRAPH
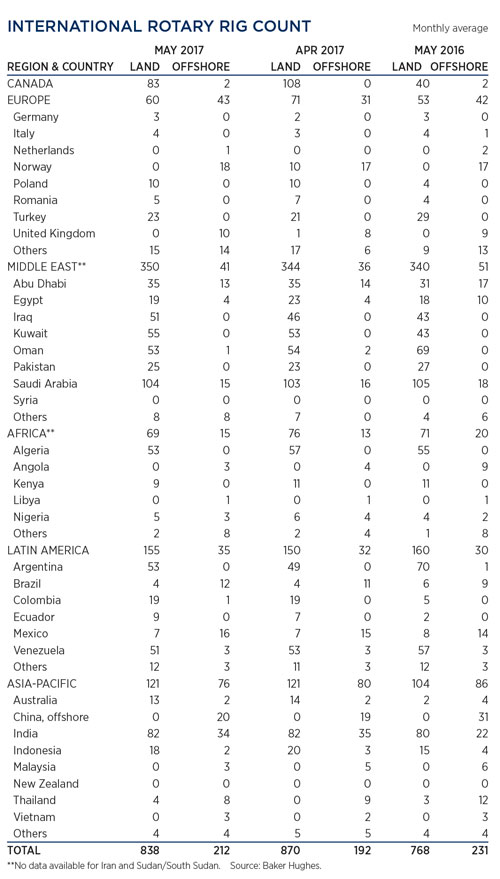
INTERNATIONAL ROTARY RIG TABLE
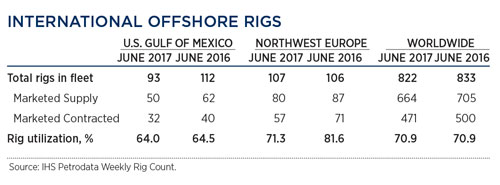
INTERNATIONAL OFFSHORE RIGS TABLE


