KEN PFAU, Forest Oil; RYAN KING, DAVID TONNER, SIMON HUGHES and MICHAEL DIX, Weatherford
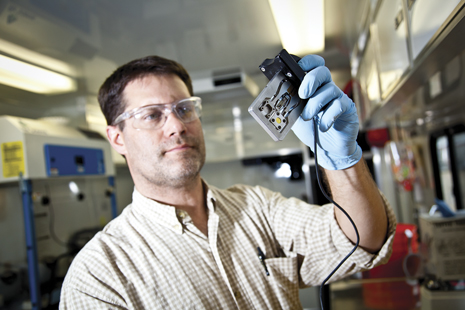 |
| The Wellsite Geoscience XRD instrument can quantify mineralogy, using a small sample of powdered cuttings. This technology is identical to that deployed on the NASA rover Curiosity to conduct mineralogical analyses on Mars. |
|
One of the earliest indications of reservoir quality comes from the mud logging unit, where loggers measure formation gas entrained in the drilling fluid and perform visual descriptions of the cuttings with a low-power microscope. Formation gas is extracted from the recirculated drilling fluid, utilizing a mechanical agitation device commonly known as a gas trap. The liberated gas is then introduced to a gas sensor or gas chromatograph (GC) to provide a gas-in-air composition. The quality of these data is limited, due to the mixing of the liberated gas with air contained in the gas trap, and because substantial amounts of unmeasured formation gas remain in the mud. This characteristic tends to skew the results toward overestimation of methane (C1) and underestimation of the heavier alkanes (C2+), as well as providing a less accurate total gas reading from the reservoir interval. For cuttings, visual inspection is qualitative, and details of the lithological description may vary, based on the experience of the individual mud logger.
To address these limitations, Weatherford has developed its wellsite geoscience service, which brings a suite of formation evaluation technologies and interpretive techniques from the lab to the wellsite. The four primary technologies that make up the service are the GC-TRACER advanced mud gas extraction/detection system, the Source Rock Analyzer (SRA) pyrolysis instrument, an X-ray diffraction (XRD) mineralogy instrument and the RockWise X-ray fluorescence (XRF) elemental analysis instrument. These portable systems provide detailed, objective data on gas composition, organic geochemical parameters (TOC and maturity), mineralogy and elemental composition/chemostratigraphy. Most importantly, the data are available in near-real time while drilling, where they can actively contribute to improved drilling and completions decisions.
Unlike core samples, which have to be specially cut from the formation and sent to a lab for analysis, mud gas and cuttings samples are natural by-products of the drilling process, and provide an essentially cost-free source of data. Wellsite geoscience instruments are all surface-based technologies that perform their analyses dependably, regardless of difficult or hostile downhole conditions. As such, they offer a cost-effective, complementary or alternative option for formation evaluation, with no risk of interfering with drilling operations.
Elemental, mineralogical and organic geochemical data collected by the instruments can be readily calibrated to baseline measurements from core, and integrated with wireline and LWD log data to provide more comprehensive formation evaluation while drilling. Taken together, these measurements can be used by the operator to assist with wellbore positioning, formation evaluation, completion design and hydraulic fracturing.
SHARPENING THE VIEW IN SHALE
The results produced by the wellsite geoscience instruments are particularly applicable to drilling operations in shale plays, where the ability to optimally extract hydrocarbons from the source rock has been challenged by incomplete or inaccurate reservoir information. As each new well is drilled, most operators initially choose a simple, geometrical approach to fracturing the entire lateral wellbore section, with little regard to changes in lithology, rock properties or actual hydrocarbon content. This practice of blind, brute-force fracturing produces mixed and unsatisfactory results, as well as a fair degree of confusion as to what constituted best practices for shale completions. This non-uniform production has been highlighted further by a recent industry study that estimated that 30% to 45% of fracture stages contribute less than 1% to overall production.
With variable production often the norm for shale wells, a consensus is emerging that accurate, timely characterization of rock attributes along horizontal wellbores is necessary to improve completion designs, and thus production results. It is critical to identify the optimal combination of hydrocarbon-bearing and brittle lithologies, and develop a production strategy.
Operators in every shale play share the common goal of finding the so-called “sweet spot” in the reservoir—one or more areas in the formation, where the rocks contain the most hydrocarbons and will respond most favorably to fracture stimulations. Key parameters that define the sweet spot for shale reservoirs include organic richness, thermal maturity, hydrocarbon types, stratigraphic continuity, mineralogy and relative brittleness.
The technologies comprising the wellsite geoscience service can determine most of these parameters from cuttings and gas analysis, while the well is being drilled. A description of how this is accomplished is as follows:
Organic richness and thermal maturity. Total organic carbon (TOC) is widely used to quantify organic richness, because it is relatively easy to measure. TOC is directly measured at the wellsite by the SRA, Fig. 1, which pyrolizes rock samples—drill cuttings or other crushed rock samples—by progressively heating them to a temperature of 600°C, followed by an oxidation phase at 580°C for 15 minutes to remove the non-convertible carbon component of the sample. A flame ionization detector (FID) and two infrared (IR) cells are used to measure and report available hydrocarbon content (S1), remaining hydrocarbon generation potential (S2), thermal maturity (Tmax) and TOC.
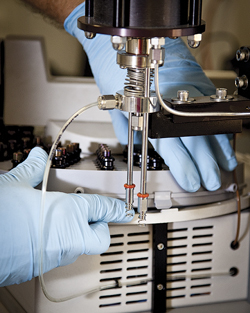 |
| Fig. 1. A Source Rock Analyzer (SRA) instrument is used for programmed pyrolysis of cuttings samples at the wellsite. |
|
Hydrocarbon types. Advanced mud gas analysis methods have proven useful for real-time fluid characterization to differentiate between liquid hydrocarbons and gas. The mud gas extraction/detection system provides a more accurate approach to mud gas extraction over conventional mud gas traps by using a semi-permeable membrane, Fig. 2, as described by Brumboi, et al. (2005). The system is inserted directly into the drilling mud stream, resulting in a gas-in-mud measurement, rather than a gas-in-air measurement.
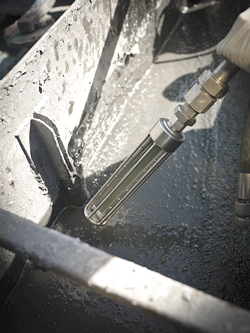 |
| Fig. 2. The GC-TRACER gas detector/analyzer uses a unique semi-permeable membrane to extract gas from the flowline, eliminating contamination by air. |
|
In 55 sec., the system provides precise compositional analysis of formation gases, including methane (C1) through octane (C8), benzene, toluene, ethene, nitrogen and CO2. These measurements can be used to infer fluid composition by comparison to gas compositions from IsoTubes/Head Space gas samples, downhole fluid samples analyzed in the lab and the gas composition of produced zones. When membrane-based advanced gas data are combined with the kerogen information and thermal maturity assessment provided by SRA analysis, a complete hydrocarbon assessment can be obtained at the wellsite.
Stratigraphic continuity. Shales, siliceous shales, marls and carbonaceous mudstones are the primary reservoir lithologies encountered in shale plays worldwide. Traditional LWD gamma-based and resistivity-based geosteering techniques, when used alone, may struggle to understand stratigraphic position in these lithologies. This is particularly important for recognizing excursions of the wellbore outside the “sweet spot,” due to fault throw, dip change or lateral facies variation. The non-unique signatures provided by only one or two LWD measurements are not sufficient for high-confidence wellbore positioning in many shale plays. This is illustrated in Fig. 3, which shows an example of an advanced mud gas log from an Eagle Ford shale well.
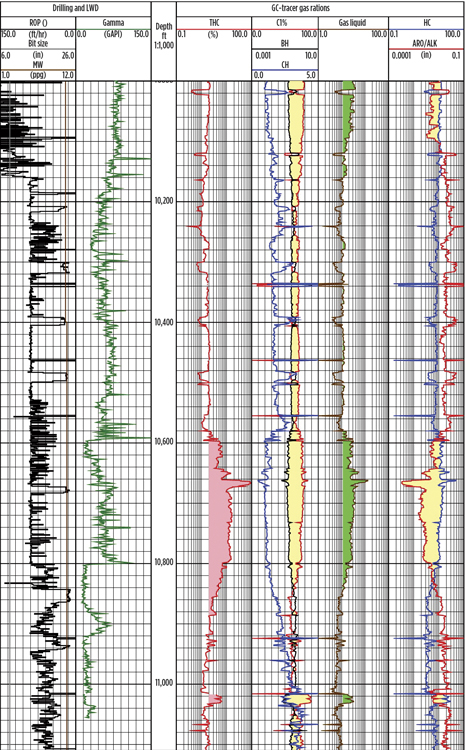 |
| Fig. 3. Advanced mud gas data are used to delineate the vertical extent of the reservoir and identify fluid type. Ratios of wetness, balance, character, aromatic/alkanes, and gas-to-liquids (G/L) have been modified to include the full range of gases measured, allowing a more complete fluid interpretation. |
|
The wellsite geoscience XRF instrument, Fig. 4, provides data for up to 31 elements in shaley lithologies, with accuracy and precision, within 30 min. of cuttings collection. The data include the 12 major elements (SiO2, TiO2, Al2O3, Fe2O3, MnO, MgO, CaO, Na2O, K2O, P2O5, S and Cl) and 19 key trace elements (V, Cr, Co, Ni, Cu, Zn, Ga, As, Rb, Sr, Y, Zr, Nb, Mo, Ba, Hf, Pb, Th and U). The 31 elements, plus a combination of an additional 100-plus elemental ratios, provide the most comprehensive data set for understanding stratigraphic position in near-real time, and for providing active input for geosteering.
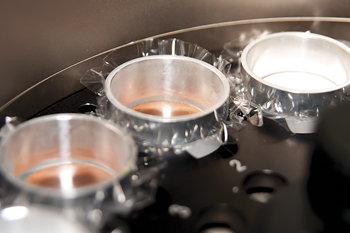 |
| Fig. 4. An X-ray fluorescence (XRF) instrument is used to perform whole-rock elemental analyses at the wellsite. Photo shows sample pellets ready for measurement in the XRF. |
|
It has long been known that certain trace metals (particularly V, Ni, Mo and U) are concentrated in shales that have been deposited in environments that experienced persistent anoxic and euxinic conditions (see review by Tribovillard, et al., 2006). Since these depositional conditions are usually very important for the preservation of high amounts of organic matter, these metals can be closely correlated to TOC values determined by the pyrolysis instrument. This correlation acts as a cross-check for organic richness, as well as providing valuable chemostratigraphic information.
In addition, XRF-measured values of K2O, Th and U can be used to calculate spectral and total gamma curves from cuttings (elemental spectral gamma). The correlation of this cuttings-derived gamma to downhole LWD gamma provides quality control for cuttings lag, as well as an independent source of backup data, should the LWD gamma sensor fail. Elemental spectral gamma data become increasingly more important, where wireline or LWD logs are more difficult to acquire due to wellbore geometry, elevated temperatures or increased vibration.
XRF elemental chemostratigraphy can be used as a stand-alone stratigraphic technique, but it is most effective when combined with wellsite geoscience XRD mineralogy and LWD data.
Mineralogy. Mineralogical composition is the most fundamental attribute of every rock, controlling the properties most relevant for oil and gas production. The wellsite XRD instrument can directly measure rock mineralogy from cuttings, generally within 30-45 min. from cuttings collection at the shaker. The instrument quantifies quartz, opal-CT, plagioclase, K-feldspar, total clay, various carbonate phases and other important minerals, including pyrite, marcasite, apatite, anhydrite and barite. Careful calibration allows precision and accuracy approaching that of lab-based XRD analysis. These mineralogy data are input directly for detailed formation evaluation, and for the calculation of a brittleness index for the shale reservoir. In combination with XRF elemental data, the XRD mineralogy can be refined to infer clay types, low levels of pyrite, apatite or anhydrite. XRD mineralogy also provides enhanced stratigraphic and diagenetic information, with plagioclase/K-feldspar and quartz/feldspar ratios being particularly important for augmenting XRF elemental data.
The direct measurement of XRD mineralogy and XRF elemental composition from closely spaced cuttings intervals (as close as 5 ft) in vertical pilot holes provides a higher-quality and lower-risk alternative to wireline elemental capture tools.
Brittleness. The relative brittleness of a rock refers to its tendency to fail (fracture) along discrete surfaces, when an external force is applied—such as the fluid pressure during hydraulic fracturing—but with little or no internal deformation between the surfaces. The brittleness of zones within shale reservoirs is of critical importance to initiating fracture networks during completions, and for maintaining open fractures that do not suffer from excessive proppant embedment. Because brittleness is directly controlled by mineralogy and the fabric/texture of the mineral components, it can be derived from properly calibrated wellsite XRD and XRF data.
Jarvie, et al. (2007) provided the first equation for a brittleness index for the Barnett shale. This equation related higher amounts of quartz (diagenetically redistributed biogenic silica and silt grains) to higher degrees of brittleness, and was a good first approximation for siliceous shales, such as the Barnett, Woodford or Monterey.
The industry soon realized, however, that this initial quartz-based equation is not applicable to all reservoirs. For example, the Haynesville, Eagle Ford, Niobrara and Vaca Muerta formations all have high carbonate contents, and it is this carbonate component, rather than quartz that imparts brittleness to the rock. Therefore, it is necessary to create reservoir-specific algorithms to correctly calculate brittleness. These formulas are verified by comparison to fundamental geomechanical data, which is still sparse in most plays, but can be estimated by wellsite XRD and XRF data.
FIELD DEPLOYMENT
There is wide acceptance in the industry that longer laterals and an increased number of fracture stages increase production. Despite this view, not all wells in a given play produce uniformly, even when completed in a similar manner. In some instances, there is significant production variability from wells in close geographic proximity.
In an attempt to maximize productivity, some operators are now depending less on the generic approach to completions and stimulation, and are investigating the potential to optimize their production by incorporating more near-real-time geological data into their completion designs.
A case study in the Eagle Ford shale highlights how integrated cuttings and mud gas analysis have been used to identify sweet spots for placement of horizontal wellbores in zones of greatest potential, Fig. 5. Experience has proven that a combination of known stratigraphic position (chemostratigraphic zone), high brittleness (as estimated from mineralogy and elemental data), proximity to zones of high organic richness (as estimated from trace element proxies V and Ni) and liquid hydrocarbon presence (as interpreted from mud gas data) work together to target the best hydrocarbon zone.
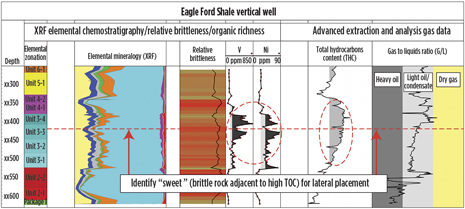 |
| Fig. 5. A combination of wellsite geoscience data and interpretation, based on XRF and advanced gas analysis, identifies the sweet spot in this Eagle Ford shale vertical pilot well. Shown on this panel are chemostratigraphic position (track 1), mineralogy (track 2), brittleness (track 3), organic richness by trace metal proxies V and Ni (tracks 4 and 5), total hydrocarbons (track 6), and hydrocarbon type (tracks 7-9). |
|
Forest Oil has used the wellsite geoscience service successfully on its drilling and completion campaign in the Eagle Ford shale. Prior to this development, the company was relying on mud logging, wireline logs and core analysis, the latter of which typically required a six- to eight-week turnaround to receive data.
Since deploying the service in January 2011, Forest Oil has consistently received reservoir data twice daily for every well being drilled. The data have allowed the company to make timely course corrections to stay within the target interval, and to confirm TOC content and brittleness of the rock they are drilling, Fig. 6.
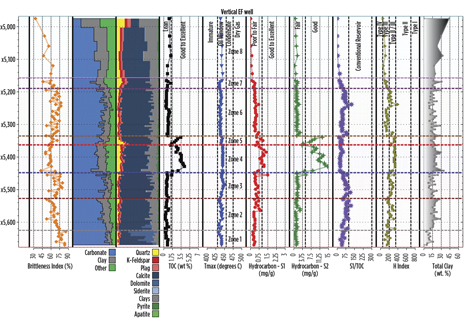 |
| Fig. 6. Different applications require different combinations of wellsite geoscience data and interpretation. Forest Oil utilized SRA and XRD to identify the target interval in this Eagle Ford shale vertical pilot well. Shown on this panel are brittleness index (track 1), mineralogy (tracks 2 and 3), TOC (track 4), key pyrolysis parameters (tracks 5 through 9) and total clay (track 10). The sweet spot in most unconventional reservoirs is the most brittle interval within or closely associated to the interval with the highest TOC and available hydrocarbon content (Zone 5 in this example). |
|
The service has also helped completions engineers plan ahead on how best to complete wells and estimate the numbers and locations of fracture stimulation stages. The strategic fracture-stage placement afforded by the system has allowed operators to save time and money by developing a truly customized completions strategy for each stage of each well. On the more than 25 wells drilled using this service, Forest Oil has been able to better optimize its completions spending, and post-stimulation production logs have confirmed the production that was forecasted from the wellsite geoscience analyses.
CONCLUSIONS
Wellsite geoscience technologies have provided operators with a powerful, cost-effective method for exploiting rich, but underappreciated sources of data: mud gas and cuttings. The suite of services is customizable to an individual client’s needs, as dictated by the challenges that they face in understanding the reservoir. This approach has been particularly effective for unconventional resource plays, primarily shales that now account for the majority of wells being drilled in North America. These surface-based measurements can all be made without the risks associated with downhole measurements, regardless of temperature, pressure or vibration in the wellbore, and with little or no impact on drilling operations. Key rock data will be collected from the well, even if wellbore conditions deteriorate and logging is not possible. These cuttings data represent an essential link back to laboratory (core) and petrophysical data sets, especially early in a play, when understanding the range of lithologies and fluids present is critical.
The near-real-time acquisition of detailed gas composition, organic geochemical parameters, mineralogy, elemental composition and chemostratigraphic position has allowed a more complete understanding of shale reservoirs while drilling and before well completion. This early knowledge increases the ability of operators to design better completions, minimize completion costs, and ultimately, optimize production. 
REFERENCES
1. Brumboiu, A.O.; D. P. Hawker, D. A. Norquay and D. Law, “Advances in chromatographic analysis of hydrocarbon gases in drilling fluids—The application of semi-permeable membrane technology to high-speed TCD gas chromatography,” paper 1160685, SPWLA 46th Annual Logging Symposium, 2005.
2. Jarvie, D.M.; R. J. Hill, T. E. Ruble and R. M. Pollastro, “Unconventional shale-gas systems: The Mississippian Barnett shale of north-central Texas as one model for thermogenic shale-gas assessment,” American Association of Petroleum Geologists Bulletin, 2007, v. 91, pp. 475-499.
3. Tribovillard, N.; T. J. Algeo, T. Lyons and A. Riboulleau, “Trace metals as paleoredox and paleoproductivity proxies: An update,” Chemical Geology, 2006, v. 232, pp. 12-32.
The authors
|
 |
KENNETH D. PFAU, who joined Forest Oil in 2008, is its chief geologist and is located in the Houston office. Mr. Pfau has 30 years of worldwide experience in exploration and development of conventional and unconven-tional resource plays. His previous work experience includes EOG Resources and Apache Corp. He holds a BS degree in geology from Louisiana State University and is a registered geologist in Texas, Wyoming and Pennsylvania. |
|
 |
RYAN KING is a technical advisor for Weatherford Laboratories, based in Golden, Co. Mr. King’s expertise concerns integrating formation evaluation data collected at the wellsite into exploration programs and completions decisions. He holds a BS degree in biochemistry from the University of Tennessee, Knoxville. |
|
 |
DAVID TONNER is Weatherford’s director of Global Sales, Surface Logging Systems, with more than 23 years of experience in the industry. His prior positions include mud logging geologist, pressure engineer, country manager, regional manager and senior executive, sales. Mr. Tonner earned his BSc degree in geology from the University of Nottingham in England, the UK. |
|
 |
SIMON HUGHES is Weatherford’s Senior Geoscience Advisor—Wellsite Geoscience Services, role in which he has about 17 years of geoscience experience, including 13 years of wellsite geochemistry. Mr. Hughes holds a BSc degree in geology from the University of London. |
|
 |
MICHAEL C. DIX is a Senior Geoscience Advisor at Weatherford Laboratories in Houston. Mr. Dix has 28 years of experience as a clastic petrologist, and for the last 13 years has focused on using elemental data for improving formation evaluation and geosteering. He received his BS degree in geology from the University of Dayton. |
|


