J. C. HORNMAN, J. VAN POPTA and C. DIDRAGA, Shell Global Solutions International, and H. DIJKERMAN, NAM, The Netherlands
Time-lapse seismic has been successful in many offshore applications, but it has been much more cumbersome when applied onshore. Successful applications are observed mainly for shallow objectives and large acoustic impedance changes, such as thermal EOR and CO2 injection. The dominant problems for onshore time-lapse are caused by near-surface variations between base and monitor surveys.1 Appropriate measures, taken in acquisition and processing, makes it possible to overcome these problems. This article demonstrates a continuous, seismic time-lapse field trial in Schoonebeek, The Netherlands, where thermal EOR is applied. These time-lapse measurements not only allow the observation of pressure and temperature variations in the reservoir, but also to quantify these variations. These measurements complement the measurements made in wells, enabling the reservoir engineer to construct more accurate dynamic models, which make it possible to make better reservoir management decisions.
FIELD PARAMETERS
Schoonebeek field is a medium, heavy-oil field situated in the northeastern Netherlands with STOIIP (stock tank oil initially in place) of one billion bbl. The crest of the structure is at about 650 m (2,133 ft), and the reservoir is around 20 m (67 ft) thick, Lower Cretaceous sandstone, with a porosity of some 30%. The oil (160 cP at 40°C, 25° API, 19% wax) has been produced cold, with some small-scale thermal EOR pilots, through more than 600 vertical wells from 1948 until 1996, when the field was abandoned. In a part of the field, production was resumed in early 2011, utilizing more efficient pumps and 69 horizontal wells. Oil production is by GASD (gravity assisted steam drive), typically using two horizontal producers at a distance of 150 m (492 ft) from the horizontal injector, which has a number of Limited Entry Perforations (LEPs).
As shown in Fig. 1, steam, injected at low pressure, is expected to rise to the top of the reservoir, spread horizontally and condense at the condensation front. Hot water will descend through the reservoir, heating the oil and improving its mobility. The reservoir engineer needs to know how the steam spreads from the injector to the neighboring producers. The pump rate could be varied, to optimize reservoir sweep.
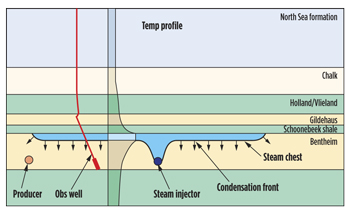 |
| Fig. 1. Steam rises from the injector to the top of the reservoir, spreads horizontally, condenses, descends and heats the oil. |
|
An example of an asymmetrical steam-chest development is shown in Fig. 2—a 3-m sub-seismic fault may delay the steam expansion beyond the fault by three years. Although a number of observation wells have been drilled, the information per observation well is restricted to a small area around it. Monitoring with surface seismic could give more areal information, provided that resolution, accuracy and precision are acceptable. After a feasibility study, it was decided to perform a permanent seismic monitoring system trial over a small part of Schoonebeek field. If successful, permanent seismic monitoring can be added to the toolbox of surveillance techniques and used to optimize field development.
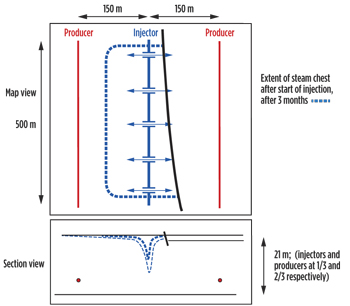 |
| Fig. 2. Asymmetric expansion of the steam chest is caused by a small throw fault. |
|
MODELING
Plans were to reduce reservoir pressure from 60 to less than 40 bars (well below the hydrostatic pressure) during a cold production period. The feasibility study was conducted by modeling the acoustic response of the pressure decline during cold production and of the steam injection. During early steam injection, pressure, temperature and steam zone thickness will change, although not in the same way—pressure changes will propagate quickly over the reservoir and will be nearly the same over the vertical dimension of the reservoir. The steam zone will be thin initially and propagate horizontally along the top of the reservoir, while temperature variations will be vertically below the steam zone, initially also near the top of the reservoir.
Fig. 3 shows some modeling results—time shifts below the reservoir were measured for a steam zone thickness of 1 m (black) and 2 m (red) as a function of the length of the temperature ramp below the steam zone. Also indicated in the figure is the time shift, due to a pressure variation of 10 bars. The resulting time shifts are not only very small, less than 0.5 ms (milliseconds), but it is also clear that a time shift can be explained by any combination of pressure, steam zone thickness and temperature ramp. To distinguish between these effects, one needs to observe the spatial distribution of the time shifts. The acoustic impedance contrast at the top of the cold reservoir is very small and will increase with higher temperatures, but the effect behaves for thin steam zone thicknesses very similar to the time shift effect, so it does not offer extra information.
 |
| Fig. 3. Shown are measurements of time shifts in microseconds on synthetic data, as influenced by changing pressure, steam zone thickness and length of temperature ramp. |
|
ACQUISITION SYSTEM
The acquisition system is fully buried, consisting of three receiver lines of 69 receiver stations, each. Each receiver station has a hydrophone at 6 m and a hydrophone at 9 m, while on the central receiver line each receiver station has an additional geophone at 9 m. The spacing between the lines is 16 m; the spacing between stations along the line is also 16 m. Twelve, highly repeatable, piezo-electric SeisMovie2 (a product of CGGV) vibrator sources were buried in cement on the central line at a depth of 25 m. All sources are emitting a single frequency at the time per source, different for each source, which enables simultaneous acquisition with all sources. In this way, a full bandwidth of 5 to 185 Hz is acquired in six hours. As these sources are rather weak, a four-fold stack is made, resulting in a monitor survey for every 24 hr. Operations are completely remote, with local temporary storage of data and transfer to the office by internet.
The source and receiver lines are located, such that they are right above the point where the two observation wells (green lines in Fig. 4) intersect the reservoir. These observation wells are equipped with pressure and temperature sensors.
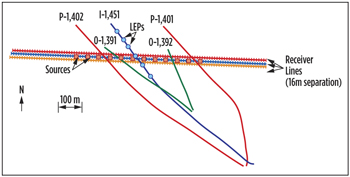 |
| Fig. 4. The seismic detectors are along the 1.1-km long black lines, the sources are indicated by the red stars. The injector well is in blue, the producer wells in red and the observation wells in green. |
|
It was immediately clear that the geophone data could not be used, due to the presence of strong Rayleigh wave energy from traffic and industrial activity. For the far field in a homogeneous medium, the pressure and particle velocity are related: P=ρcv, with P: pressure, ρ: density, c: medium velocity, v: particle velocity. Accordingly, we expect Ps/Pp=cs/cp.vs/vp with index s and p for shear- and p-waves respectively. The shear-wave velocity is about 250 m/s, and the p-wave velocity is about 1,500 m/s. So, for a given ratio of particle velocities for shear- and p-waves, the ratio of the pressures for shear—and p—waves is much smaller. In this area, pressure sensors are much less sensitive to Rayleigh and shear waves than particle-velocity sensors.
PROCESSING
In time-lapse processing, the steps for base and monitor surveys need to be identical if possible, and need to address differences outside the reservoir between base and monitor surveys. Even though the sources and detectors are buried and will neither suffer from position repeatability errors, nor from coupling variations, there will be calendar-time near-surface variations. These three surface-related variations were observed in the data, Fig. 5:
• The receiver ghost, causing a notch at 100 Hz for the 9-m hydrophone and at 150 Hz for the 6-m hydrophone, corresponds with a near-surface reflection coefficient of about -0.4. Any change in the reflection coefficient or in the travel time between detector and surface will change the ghost spectrum.
• The travel times of surface multiples will also be affected by changes in the near-surface velocity.
• The most important varying noise was caused by SV-waves generated by the sources and converted to p-waves at ditches and refracted at a shallow refractor. In particular, the SV-leg of this event is sensitive to changes in the near-surface.
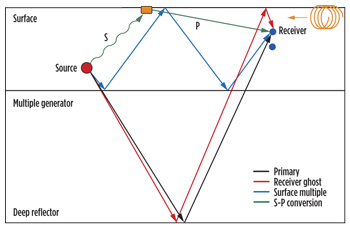 |
| Fig. 5. Calendar-time variant noise types, as observed on the data. |
|
The importance of these types of noise is demonstrated in Fig. 6—the travel times at a horizon above the reservoir do show a variation, which does not correlate in any way with the production, but does correlate with the temperature at surface. The magnitude of these time shifts is significant compared to the expected time shifts, due to production effects. An effort was made by Τ-p filtering to remove the S-P conversions and the multiples. The receiver ghost was suppressed by utilizing the over/under hydrophones, attenuating the down-going waves. The intention was to suppress the receiver ghost by PZ summation using geophones and hydrophones, but the high noise levels on the geophone signal prevented this. It was necessary to make a rolling average over seven days for the monitor surveys to improve the signal-to-noise ratio. Editing of noisy traces was done, but for every monitor survey, base survey was constructed (always the first seven days) based on the lowest common denominator of traces between base and monitor. Source- and receiver-consistent, 4D statics were also applied—although both sources and receivers are below any weathered zone, one of the sources was not properly cemented and moved slightly, causing a 4D shot static of up to 0.1 ms. This may seem negligible, but the model study already indicated that this effect is highly significant compared to the reservoir changes and needs to be taken into account.
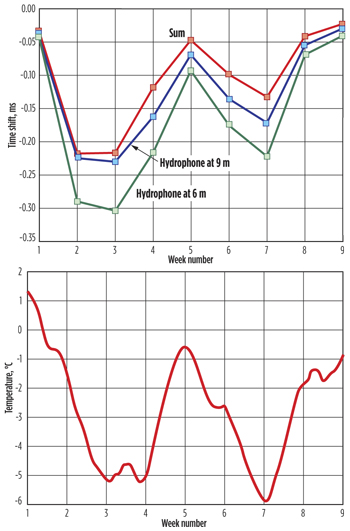 |
| Fig. 6. Top: time shifts, measured above reservoir over an eight-week period. Bottom: average outside temperature over the same period. |
|
RESULTS
Time shifts were measured on a daily basis. Above the reservoir, hardly any time shifts are observed, but Fig. 7 shows time shifts below the reservoir with respect to the base survey. Almost immediately after start of injection, a slowdown is observed, centered on the injector. As this happens instantaneously over a considerable area, these variations are caused by pressure changes. These pressure changes are observed with variable strength, suggesting that some areas have less communication with the injector than other areas. For instance, at observation well 1392, the observed time shifts are smaller than at observation well 1391. It is also obvious that the time shifts at injector 1451 are the largest of all. Because it is known that the pressure must have spread over a large area, the high values very close to the injector are not only showing pressure, but also heat and/or saturation effects. From well gauges, it is known that the temperature at wells 1391 and 1392 is still low.
 |
| Fig. 7. Time shifts measured below reservoir. The E-W position along the line is on the vertical axis, the day of the monitor survey along the horizontal axis. The white zones have lower multiplicity and a correlation coefficient <0.9. On the right side, wells are indicated with P, producer; I, injector; O, observation well. Negative numbers represent a slowdown. |
|
At the position of producer 1401, positive time shifts are measured, indicating a decrease in pressure with respect to the base survey; producer 1402 is just outside the zone of sufficient data quality. The question arises whether these time shifts can be related to pressure and possible other variables, not only qualitatively, but also quantitatively. Figure 8 shows the pressures in observation well 1391 (green) and the time shifts at the location of that well. Due to a failing source, a change of base survey was required on March 29, causing a discontinuity on the time shifts. Until the end of August, the time shift in well 1391, where the temperature remained constant, tracks the pressure very well, as shown in Fig. 9.
 |
| Fig. 8. Time shifts (solid lines, left scale) and pressures (dotted lines, inverted right scale) are shown as a function of calendar time. The pressure in well 1451 is only known for the period from late October, when it was kept constant at 40 bars. The blue vertical line indicates the start of cold production, when the pressure decreased from 60 to 10 bars, the red vertical line indicates the start of steam injection. |
|
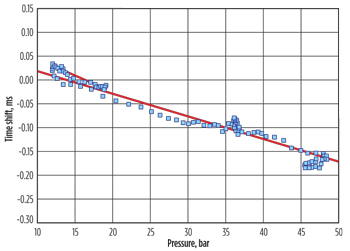 |
| Fig. 9. The relationship between time shift and pressure is shown for well 1391 during depletion and injection until August. Solid symbols represent depletion; open symbols are injection. |
|
Time shifts change with pressure at a rate of 5 µs per bar. At the pressure decrease in early September, the two curves separate, but they overlap again during the pressure increase in early October. When pressure is decreased a second time from mid-October, the curves start to separate again. The interpretation of these separations between pressure and time shift curves indicates the presence of gas, transported from injector to observation well. For the injector well, the pressure is only known for the very last two weeks of the plot, when it was kept constant at 40 bars, nearly the same as in the observation well. Clearly the time shift at injector 1451 is more negative than at observation well 1391, even when the pressure is the same. The interpretation for that difference is a combined heat/gas effect, with a magnitude of about 0.1 ms. From Fig. 2, this is interpreted as a steam zone and a temperature ramp below that of altogether, not more than 1.5 m at the location of the injector.
The changes in time shifts are rapid, and interpretation of these changes is possible due to the fact that the monitoring is continuous. With a conventional, surface seismic 4D, every few years, it would have been hard to achieve the accuracy and precision; even if that was achieved, the interpretation at such sparse intervals would have suffered from aliasing problems.
CONCLUSION
By taking measures in acquisition and processing, time shifts can be measured from surface with a precision and accuracy of a fraction of ms, corresponding with pressure changes of less than 10 bars. With that information and the knowledge that pressures propagate more rapidly than temperature changes, it is possible to determine temperature effects as well. Based on these results, Shell is planning to expand the trial with more source and receiver lines to get a more areal view of the propagation of the steam and heat front. 
ACKNOWLEDGMENTS
We gratefully acknowledge the support of NAM staff, including F.Jelgersma, O.Shokoya, C.Corsten and H.Ardesch, as well as the useful discussions with J.L.Lopez of Shell International and E.Forgues, F-X.Gresillon, J.Cotton and J. Meunier of CGGVeritas.
LITERATURE CITED
1. Pevzner, R., V. Shulakova, A. Kepic, and M. Urosevic, 2011. “Repeatability analysis of land time-lapse seismic data: CO2CRC Otway pilot project case study,” Geophysical Prospecting 59 (1): 66-77.
2. Schisselé, E., E. Forgues, J. Echappé, J. Meunier, O. de Pellegars, and C. Hubans, 2010. “Seismic Repeatability - Is There a Limit?”, 72nd EAGE Conference, Extended Abstracts, V021.
This article is based upon SPE Paper 152015, which was presented at the SPE Intelligent Energy International Conference in Utrecht, The Netherlands, March 27-29, 2012.
|
The authors
|
|
KEES HORNMAN is a physicist and graduate of the University of Utrecht. He has been with Shell since 1978 as a geophysicist in operations and research. He is currently with Shell Projects and Technology R&D, focusing on time-lapse seismic onshore.
|
|
| JOHAN VAN POPTA received a masters degree in Experimental Physics from the University of Groningen in 1977 and joined Shell in 1979. His career has been spent mostly in research, but includes operational postings in Aberdeen and Oman. At present, he is a senior petrophysicist, working in a team developing and applying methods for areal monitoring of producing fields. |
|
| CATALIN DIDRAGA earned his PhD in 2004 in theoretical physics from the University of Groningen, The Netherlands. In 2007, he joined the R&D division of Shell International Exploration & Production BV as a member of the Areal Field Monitoring team. |
|
| HANS DIJKERMAN is an operational geophysicist, who worked for NAM in The Netherlands until 2011. Since then, he has worked for Salym Petroleum Development in Russia as a seismic project manager. |
|


