Duane Dopkin and Jean-Claude Dulac, Paradigm
Advances in the seismic fields have been stimulated by changes in seismic acquisition, advances in supporting hardware and graphics, the complexity of exploration and exploitation of modern day assets, new architectures for subsurface modeling and a better understanding of how the quality of the seismic image depends on the interpretation process. This article examines some of these new technologies.
USING PRE-STACK DATA
Seismic interpreters work with images reconstructed from hundreds of gigabytes or tens of terabytes of seismic data recorded at the surface of the Earth. That reconstruction is carried out with a supplied velocity model and a seismic imaging procedure. Most seismic imaging applications decompose the recorded seismic data into organized collections of trace data, commonly referred to as pre-stack seismic data gathers. The organization of these gathers can vary significantly according to the imaging algorithm. Gathers may be sampled by acquisition offset, subsurface angle, image distance, ray parameter (plane waves) and even azimuth (surface or subsurface). Regardless of the gather type, pre-stack data provides a sound basis for the evaluation of seismic data quality, an assessment of the velocity model description (e.g., anisotropy) and accuracy, the discrimination of reflector types (e.g., primary from multiple, compressional from converted waves) and the confirmation of fluid and lithology determinations based on reflectivity modeling and inversion procedures (e.g., AVA).
Historically, the use and analysis of pre-stack data were reserved for applications and windows foreign to the main interpretation canvas. However, increases in network bandwidth, disk speeds and computer memory coupled with advances in software engineering (e.g., efficient roaming formats, acceptable compression schemes and parallel data reads) have made access to and direct use of pre-stack data a practical solution for interpreters in their preferred canvases.
The timing of these advances is essential, as seismic imaging algorithms are driven by geologically constrained and parameterized velocity models, requiring collaborative decision making between velocity modelers, seismic imagers and seismic interpreters to assure a quality image and quality outcome. Pre-stack seismic data provides an objective assessment of the outcome and should be considered a standard interpretation data object.
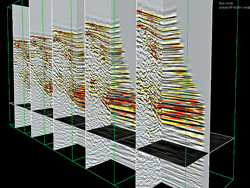
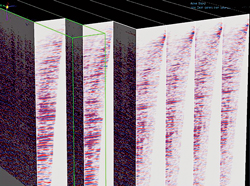
Different views of the pre-stack data can be invoked to meet different project objectives. The simultaneous display of multi-line gathers (Fig. 1) provides a convenient way to quickly assess the integrity of the seismic data processing and imaging procedure and the resultant image quality. Here, the software and hardware advances referenced previously have a huge influence on the efficacy of the process of roaming through large volumes of pre-stack data. Equivalent views with angle gathers (Fig. 2) provide a reliability assessment of direct hydrocarbon indicator (DHI) attributes derived by AVO/AVA procedures. This assessment is made on data generated in the local angle domain where direct observation is carried out in the appropriate subsurface physical domain most suitable for this analysis.
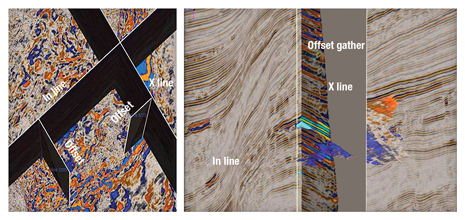
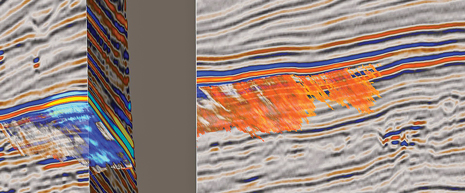
Juxtaposed displays of pre-stack and post-stack data allow a convenient discrimination between different sources and types of seismic reflectors (Fig. 3) and an assessment of the imaging velocity model. By bringing pre-stack data into a common interpretation canvas, computer-assisted horizon propagations can be extended to the pre-stack domain, Fig. 4. This rich set of multi-valued picks provides a compact representation for velocity model QC and also serves as the primary input for velocity model updating schemes (tomography).
 |
|
Fig. 1. Multi-line offset gathers.
|
|
 |
|
Fig. 2. Multi-line angle gathers.
|
|
By extending interpretation canvas support to pre-stack data, years of interpretation development and a wealth of interpretation utilities are available for application to this new data object. Also, it opens the door to the convenient application of other operations that make use of pre-stack data and supporting geomodels, such as velocity updating, pre-stack inversion and selective stacking.
THE IMPACT OF AZIMUTH
Collaboration has also broadened the interpreters’ understanding of the dependency of seismic reflection data on the acquisition and velocity model. While subsurface illumination has been proven to provide a very useful bridging technology for these domains, the process has traditionally been carried out in special applications that are foreign to the primary interpretation canvas. This process is more effectively carried out in the interpretation canvas, where illumination scenarios can be evaluated with different velocity models or seismic acquisitions, or even different ray-tracing methods. By pulling these technologies together, interpreters are able to qualify seismic blind spots (areas with poor subsurface illumination) by assessing reflection reliability, a quantitative measurement that can lead to a higher confidence in subsurface interpretation.
To carry this process out in the primary interpretation canvas, the system must be engineered to support the registration of multiple velocity models for the import of seismic acquisitions. More importantly, the system must also be equipped with diagnostics that allow interpreters to qualify subsurface reflectors. To be effective, subsurface illumination must tell the seismic imaging and interpretation story in a clear and visual manner, with immediate and meaningful results obtained from different acquisition or velocity model scenarios.
Subsurface illumination is routinely carried out with ray-tracing procedures. Here, a rich ray-tracing procedure based on a bottom-up, exploding diffractor model is used. This engine traces rays in all angles and all directions to secure a uniform illumination of the subsurface and to properly map surface-recorded data to subsurface image points. The ray tracing is performed in the “local angle domain,” a system that describes the interaction of the incident and reflected wave fields.
The result is a rich set of illumination factors, plus angle-dependent and physical ray attributes (e.g., travel time, geometric spreading, phase rotation indices or reliability factors) that are essential for quality control of imaging results, especially below complex geological structures. These results give interpreters useful information about the complexity of the subsurface velocity grid and provide a better understanding of the limitations of a given acquisition geometry, particularly the relation between the surface displacements and offsets and the subsurface directional and reflection angles.
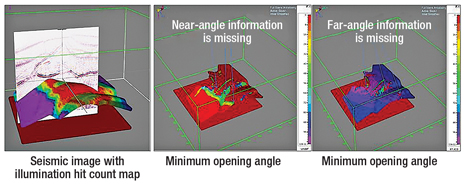
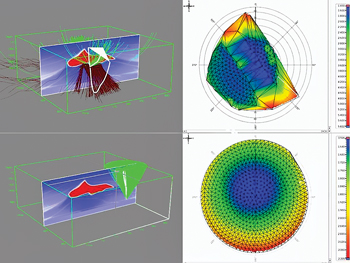
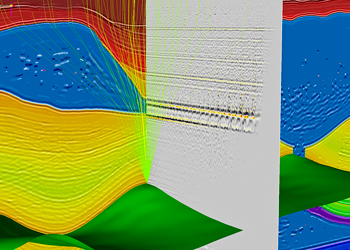
Interactive ray tracing allows interpreters to qualify subsurface image reflectors in terms of insufficient data coverage. Figure 5, for example, highlights areas of missing near- and far-angle data, information that can help qualify both the integrity of the velocity model and any DHI attributes derived at these locations. More importantly, it allows interpreters to evaluate any of the physical ray parameters as a function of both surface and subsurface angles and distances (Fig. 6), a key to a better understanding of the richness (or lack thereof) in subsurface illumination, and the reliability of the subsurface reflector. Pre-stack data can also be worked into the subsurface illumination process (Fig. 7), providing a full correlation between the stacked response, unstacked response and illumination attributes.
 |
|
Fig. 3. Juxtaposed views of pre- and post-stack seismic. Data courtesy of AWE Ltd.
|
|
 |
|
Fig. 4. Pre-stack picking with computer-assisted procedures. Data courtesy of AWE Ltd.
|
|
TRUE 3D MODELING
Interpretation, either automatic or manual, results in a sparse representation of a series of horizons and faults. These sparse representations need to be made coherent into a consistent structural model where faults form a consistent fault network that correctly intersects horizons. This structural model can be used to control the creation of a geological or reservoir model, to construct an impedance model for inversion or a velocity model for imaging or time-to-depth conversion, or to perform structural analysis with surface or volume restoration or fault seal analysis.
Until recently, the creation of the structural model was difficult and time-consuming. Because of its specificity and limitations, this model could not be used to construct a geological, reservoir, chrono-stratigraphic or velocity model. Consequently, users resorted to re-building different models for different applications, losing large amounts of time and accuracy in the process.
Using a modeling engine capable of building a “true” shared Earth model, and by bringing this simple modeling engine inside the interpretation world, interpreters can provide consistent and reusable structural and stratigraphic information to the geologist, reservoir geophysicist and reservoir engineer.
SPACE-TIME FRAMEWORK
Any particle of sediment observed today in the geological domain G holds the following series of properties:
• The coordinates (x,y,z) where (x,y) are the geographical coordinates and (z) is the altitude as observed today
• The coordinates (u,v,t) where (t) is the geological-time of deposition of the particle and (u,v) are its paleo-geographic coordinates at geological time (t).
The (x,y,z) coordinates and the (u,v,t) paleo-coordinates so defined are intimately linked by three functions:
u = u(x,y,z); v = v(x,y,z); t = t(x,y,z)
The functions u(x,y,z), v(x,y,z) and t(x,y,z) allow any location (x,y,z) in the geological domain G to be transformed into a location (u,v,t) in the depositional domain G*. Such a transformation is called the UVT transform.
UVT TRASFORM
The construction of the UVT transform uses a very simple observation. A horizon H(t) located in the XYZ space should be flat in the UVT space. In addition, we want the distortions of H*(t) to be minimized when we do this operation so that horizontal and stratigraphic distances are preserved. It should be noted that faults are discontinuities for the functions u, v and t. Given these constraints, horizon and fault interpretations provide all the information needed to construct the UVT transform.
 |
|
Fig. 5. Subsurface illumination for the determination of angle coverage.
|
|
 |
|
Fig. 6. Qualifying reflector reliability.
|
|
 |
|
Fig. 7. Subsurface Illumination with pre-stack data.
|
|
Once the UVT transform is computed inside of any type of fault framework, all XYT points have associated and known points in UVT space. Consequently, all horizons for all T’s are known and each of these T surfaces is faulted. Collectively, the horizons with the faults constitute a stratigraphically consistent 3D structural model.
In addition to these simple rules, additional geologic rules can be enforced while constructing the UVT transform to enforce a “more” geological model:
• Honoring dip/azimuth information anywhere in the volume—for example, well dip meter data or surface dip measurement provides internal layer geometry information used by the UVT transform
• Honoring well path information—for example, the layer geometry is constrained by the fact that a particular section of the well path did not intersect the top or base of the layer
• Honoring fault type (normal, inverse) information—for example, enforcing that the horizon contacts should not cross on the fault plane
• Honoring sequential stratigraphic and erosion rules—for example, enforcing that the horizon was not deposited in a particular area
• Honoring intra-formation chrono-stratigraphy—similar to dip meter data, intra-layer picks can be used to better control the UVT transform, which in turn will get the UVT space better aligned with seismic signal, condition sine-qua-non of correctly merging well information and seismic information away from the wells.
A model with many uses. As the full UVT model is constructed, every point of the subsurface knows its paleo-geographic coordinates (i.e., its coordinate at the time of deposition). With this information, many different attributes can be computed and many additional transformations can be performed to validate the interpretation. Examples include:
• Computing the probability of fracturing and the directions of fractures at any location in a reservoir from the deformation and mechanical attributes of the rock type inside the layer
• Restoring a UVT-based model sequentially to understand the paleo-basin geometry (the restoration of the 3D model is done using the mesh supporting the UVT transform)
• Performing flattening of seismic volumes to perform interpretation QC and UVT model QC
• Computing displacement maps
everywhere on the faults surface
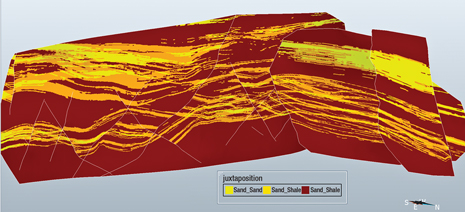
• Computing juxtaposition maps, Fig. 8
• Computing the deformation of the layers between the XYZ space and the flattened space, strain and stress
• Computing shale-gauge ratio and weighted shale-gauge ratio on faults.
This ratio is computed using an additional parameter—the maximum smearing distance of the shale from its “origin” inside the fault plane. Typical shale-gauge ratio supposes that the shale layer is smeared equally along the fault plane. The clay smear potential is sometimes used as well, but this shale-gauge ratio combines both sets of information.
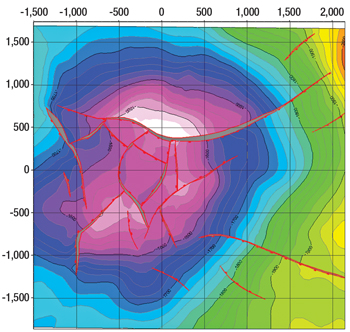
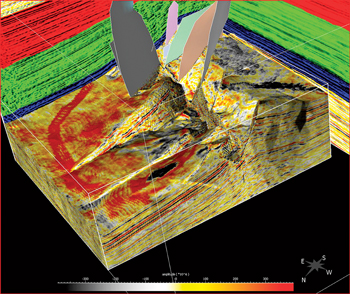
Workflow optimization. As a “true” shared earth model, the UVT model can have many direct and immediate outputs, optimizing the workflow between interpretation, structural geology and reservoir modeling and simulation.
 |
|
Fig. 8. Juxtaposition of well facies against three fault surfaces.
|
|
 |
|
Fig. 9. Direct map output from UVT model.
|
|
 |
|
Fig. 10. Faulted chrono-stratigraphic slice inside UVT model highlighting stratigraphic feature.
|
|
CONCLUSIONS
Seismic interpreters and geomodelers can extend their reach with access to new data objects and new technologies to strengthen their exploration and development programs. Changes in seismic acquisition and increased desktop computation power, coupled with advances in geoscience and computer science, ensure that interpretation and modeling will not remain static. 
|
THE AUTHORS
|
| Duane Dopkin is a Geophysicist and Executive VP of Technology for Paradigm. He has over 20 years of experience in subsurface imaging and hydrocarbon detection. His current responsibilities combine product management with research and development of high-end applications, solutions and workflows for the oil and gas industry. Dopkin holds a BS degree in geosciences from the Pennsylvania State University and an MS degree in geosciences from the University of Houston at Clear Lake. |
|
| Jean-Claude Dulac is Chief Technology Officer for Interpretation and Modeling at Paradigm. Before joining the company, he was founder and Chief Architect of Earth Decision. That company was acquired by Paradigm in 2006. Dulac holds an MS degree in geophysics from Stanford University and an MS degree in geology from Ecole Nationale Supérieure de Géologie in France. |
|


