Bad data distort industry market perceptions
Bad data distort industry, market perceptionsFollowing his June 1999 article that analyzed IEA’s serious supply and demand mistakes, the author – a principal at one of the world’s most accurate consulting firms – shows how IEA’s bad statistical assumptions continue to distort the industry’s perception of, and reaction to, oil market conditionsGeorge S. Littell, Groppe, Long & Littell, Houston
It is unfortunate that OMR sets itself a tough task – constructing balances by volume on the deliveries basis – and then does it badly. The basic problem is the use of low estimates for processing gains, ranging anywhere from 1.5 million to 1.7 million bopd. Actual processing gains in recent experience have been 2.8 million to 2.9 million bopd, the distribution of which is shown in Table 1.
As regards distribution of these gains, refineries in the U.S. process nearly one-fourth of the world’s oil. If all the refineries elsewhere were as sophisticated, the world processing gain would be 3.4 million to 3.6 million bopd. Since they are not, it is less. The OMR estimates, however, are ridiculously low. They are even less than what is apparent from the statistics of the members of the Organisation for Economic Cooperation and Development (OECD). To reach a balance with the low processing gain figures, OMR has to understate deliveries – which it mislabels as "demand" – or overstate production. In practice, OMR does both, as well as employing a balancing item in stocks in non-OECD countries (i.e., nations lacking good statistics). Because members of the Organization of Petroleum Exporting Countries (OPEC) do not provide timely statistics, their production is most easily overstated. This is caused by not distinguishing between crude oil, condensate and natural gas liquids. OPEC members do this, of course, to preserve the option for fraud. OMR should not be blamed for that, and it has lots of company in the industry trade press in terms of reporting "cheating" vs. quotas that apply only to crude oil. In 1997 and 1998, OMR overstated production by unusually large amounts. The resulting positive balancing item has been termed "missing barrels," a category outside coverage in OECD statistics. In 1999, better numbers for OPEC production have resulted in what may be termed "phantom drawdowns," Table 2.
IEA is also a statistical agency, yet data for all OECD members has been published only through second-quarter 1999. Based on the evidence available, it appears that IEA is headed toward a 1.2-million-bopd "phantom drawdown" over all of 1999, Table 3. Such a phantom drawdown in 1999 is, of course, just as illusory as the missing barrels of 1997 and 1998.
Basic Concepts Oil production has three categories:
Refineries convert crude oil, condensate and gas liquids into useful products, such as gasoline, naphtha, jet fuel, diesel, residual fuel oil, lubricants, wax, asphalt, coke, etc. In addition to the international trade in crude oil, condensate and gas liquids, there is extensive commerce in refined products. The simple basis for oil balances is to begin with production, i.e., the production basis. In the production basis, deliveries for a country or area are obtained by this formula:
The more difficult method is to begin with deliveries of refined products and gas liquids, or the deliveries basis. The formula for determining this balance is:
Aside from small amounts of hydrogen that may be added, the refining processes do not change the weight of the hydrocarbons refined. Many of the processes (cracking, reforming, etc.) result in products that are less dense than the input. The volume of products from a refinery – not their weight – typically exceeds the volume of the input of crude oil, condensate, etc., by 1% to 6%, depending upon the combination of processes employed. The difference between output and input volumes is termed processing gain. Data Sources Although oil is sold by volume, the data is reported either as a volume – gallons, barrels, cubic meters, etc. – or as a calculated weight (usually metric tons). It requires time to collect and audit the data. For OECD members, statistics by weight for the first two quarters of 1999 are available in the IEA publication, Oil, Gas, Coal, & Electricity: Quarterly Statistics. In the U.S., the Energy Information Administration has published statistics by volume for the first three quarters of 1999. Comprehensive statistics, by weight, for the entire world are compiled by the United Nations. They have been published for activity ending with 1996. Data on exports are also published by OPEC in its Annual Statistical Bulletin. The latest edition of this that has been published covers calendar-year 1998. As a rule, export statistics are less reliable than import numbers. People can report only what they know, and ship destinations are subject to change. It is easier for an importing country to determine where oil came from than it is for an exporting nation to know where it went. Balances And Trade Rather than rely on the anonymous "sources" used by OMR and the trade press, industry-watchers can construct an oil balance from the trade statistics of OECD members. While they produce less than 28% of the world’s oil, OECD members consume over 61% of it. Expanded to include trade flows – where crude supplies come from and where they go – world oil balances can be presented on the deliveries basis, Table 4. Of course, it is much easier to do the trade balances on the production basis without the processing gains.
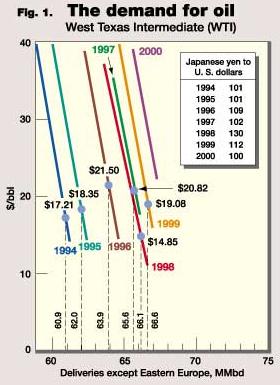
Demand For Oil Even without tracing trade flows, the OMR authors should realize that something is wrong when the balancing item comes out to be a large number in either direction. In the normal processes of the global oil business, the bulk of stocks is necessary to conduct operations. The remainder handles seasonal swings in product consumption. Between one December 31 and the next, the usual change in stocks in either direction is less than 100 million bbl, or 300,000 bopd averaged over 365 or 366 days. In economics, "demand" is a technical term that refers to the relationship between price and consumption of a good or service. The relationship is, of course, inverse – at high prices, consumption will be low and vice versa. Oil is an inherently unstable business, because the demand is "inelastic." In the short term of a year or less, consumption does not change much over a wide range of prices. Where the price ends up depends on the amount of supply. Without some control over supply by OPEC, oil prices could be expected to be volatile in the manner of the U.S. natural gas industry, where producers work hard to sell all the gas they can every day. Leaving out Eastern Europe, the demand for oil over time can be illustrated as a series of lines. This is evident in the chart for years 1994 through 2000, for demand outside Eastern Europe, Fig. 1. As a rule, all Eastern European statistics are suspect. What can be measured accurately is that region’s trade with the rest of the world.
As drawn, the lines relate price to deliveries rather than consumption. Deliveries differ from consumption by the amount of stocks that consumers hold in their cars, trucks, airplanes, houses, etc. The statistical system cannot measure consumption, because there are millions of consumers. It can measure deliveries by the oil industry, from which it collects data. The term "growth in demand" describes a shift to the right as time passes – at any given price, deliveries are greater than they were in previous years. Were demand to be totally inelastic – deliveries are the same at any price – the demand for any given year would be a vertical line. As drawn, the lines are not vertical, but they are not far from it. It is doubtful that demand curves for oil are linear. They are drawn in that manner for convenience. With a linear demand equation, almost any freshman economics student can calculate the combination of price and deliveries that yields maximum revenue to OPEC. After the fact, only one point on the demand curve for a year is known – the actual combination of price and deliveries. The year 1998 was unusual, in that the demand for oil actually declined, due to economic difficulties in Asia and elsewhere (i.e., the line for 1998 is to the left of the line for 1997). Those difficulties began after two years of rising oil prices. They also occurred in the middle of shifting currency values best illustrated by the Japanese yen, Table 5.
Since international oil transactions are settled in U.S. dollars, the decline in the exchange value of the yen made the increase in oil prices even larger. Like a drought, flood or other natural catastrophe, a sudden increase in energy costs does have adverse economic effects. It is the sort of thing that exposes weaknesses in banking and other structures of an economy. It has done so before in the industrialized West. OPEC The other notable event of 1998 was that, for practical purposes, Iraq gained relief from the oil embargo in June. It has been producing at capacity ever since. As late as the end of 1997, OPEC was still operating with quotas established in September 1993. Since 1997, it has had four sets of quotas for production of crude oil, as shown in Table 6. Actual OPEC production derived from import statistics is listed in Table 7.
OPEC members did not do anything in March 1999 that they could not have done
in 1998. Confusion about the numbers – particularly the distinction between crude oil, condensate and gas
liquids – was a factor in the delay. When members did act in March 1999 to offset the increase in Iraqi
output, they made a radical adjustment and were pleasantly surprised by the results.
The author
|
|||||||||||||||||||||||||||||||||||||||||||||||||||||||||||||||||||||||||||||||||||||||||||||||||||||||||||||||||||||||||||||||||||||||||||||||||||||||||||||||||||||||||||||||||||||||||||||||||||||||||||||||||||||||||||||||||||||||||||||||||||||||||||||||||||||||||||||||||||||||||||||||||||||||||||||||||||||||||||||||||||||||||||||||||||||||||||||||||||||||||||||||||||||||||||||||||||||||||||||||||||||||||||||||||||||||||||||||||||||||||||||||||||||||||||||||||||||||||||||||||||||||||||||||||||||||||||||||||||||||||||||||||||||||||||||||||||||||||||||||||||||||||||||||||||||||||||||||||||||||||||||||||||||||||||||||||||||||||||||||||||||||||||||||||||||||||||||||||||||||||||||||||||||||||||||||||||||||||||||||||||||||||||||||||||||||||||||||||||||||||||||||||||||||||||||||||||||||||||||||||||||||||||||||||||||||||||||||||||||||||||||||||||||||||||||||||||||||||||||||||||||||||||||||||||||||||||||||||||||||||||||||||||||||||||||||||||||||||||||||||||||||||||||||||||||||||||||||||||||||

- Applying ultra-deep LWD resistivity technology successfully in a SAGD operation (May 2019)
- Adoption of wireless intelligent completions advances (May 2019)
- Majors double down as takeaway crunch eases (April 2019)
- What’s new in well logging and formation evaluation (April 2019)
- Qualification of a 20,000-psi subsea BOP: A collaborative approach (February 2019)
- ConocoPhillips’ Greg Leveille sees rapid trajectory of technical advancement continuing (February 2019)

