Prospects for activity on the UKCS after the oil price collapse
The last several months have witnessed some astonishing developments in the world oil market. The coronavirus problem has reduced world oil demand substantially, with guesstimates of 20% to 40% for 2020, from a 100-MMbpd peak in 2019. This has occurred at a time when OPEC and its collaborating non-members, principally Russia, failed to reach an agreement on production cuts in mid-March to counter the existing weakness in the market, in the face of steadily increasing U.S. production.
Saudi Arabia’s reaction, by announcing major increases in production, perhaps to around 12 MMbopd, and to signal large price discounts from April 2020, quickly resulted in a dramatic fall in oil prices. The result was renewed negotiations in April between OPEC and collaborators, principally Russia, resulting in an agreement to cut production by 9.7 MMbopd from May. This is nearly 10% of peak world demand. The agreement also indicated production cuts extending for specified periods into 2021. The result has been some rebound in the price, reflecting the belief of traders that the agreement would have a significant effect, at least in the near term.
The world gas market also has shown signs of price weakness for some months, reflecting the effects of growing production from several countries, including Australia and the U.S. Russia is a major gas exporter and it is noteworthy that this country’s contract prices are generally indexed to oil prices. This puts further downward pressure on wholesale gas prices.
Where markets will evolve is particularly difficult to predict. On the demand side, much depends on how long the virus problem persists. This clearly has a major influence on world oil demand. On the supply side, much depends on OPEC’s behaviour, with and without its collaborators. Traders will be carefully watching the participants’ behaviour toward the agreement, to assess how closely they are keeping to it, as some of them were reluctant to join.
Russia was concerned that a main beneficiary of the agreement would be the U.S., whose shale oil sector was suffering from low prices. This sector has shown remarkable growth over the last decade or so. But at current oil (and gas) prices, the likely returns are unattractive. This applies not only to new field developments, but to production from existing fields. Continuous drilling is necessary to prevent very rapid declines in production. At existing prices, such drilling is not economically attractive. Consequently, shale sector production is falling.
The above, key factors determining world oil (and gas) prices have much uncertainty surrounding their future behaviour, both in the short and medium terms. The medium-term future of oil prices also depends on the reaction of governments and consumers to energy transition issues. It also depends on the attitudes and reactions of investors in the oil sector, and their stakeholders and other financiers.
The present study examines the prospects for UKCS activity in the context of relatively low oil and gas prices used for investment screening purposes. An underlying assumption is that the extremely low prices likely to be experienced in 2020 will be modified somewhat in 2021, but a range of still relatively low prices (by the standards of the last 20 years) could prevail for a long time ahead.
METHODOLOGY AND DATA
In this study, production and expenditure projections have been made by using financial simulation modelling, including the use of the Monte Carlo technique to take account of various risks. The modelling made use of a large database, consisting of more than 404 already-sanctioned fields, plus information on 95 possible incremental projects, and 18 probable and six possible future fields being considered for development by operators. This information was supplemented by projections of possible future incremental projects, the possible results of new exploration, and a large database of 411 fields in the category of technical reserves. Estimates of their reserves have been made from information obtained from a variety of sources. Further estimates have been made of their development and operating costs, production decline rates, and decommissioning costs.
The Monte Carlo technique was used to estimate the number of possible new discoveries for the period until 2051. The modelling was based on data regarding recent trends in exploration, success rates, reserves found, and their type (oil, gas or condensate). For the Central North Sea/Moray Firth (CNS/MF), Southern North Sea (SNS), and Northern North Sea (NNS) five-year moving averages of effort, the success rate, unit costs, reserves and type were used to find the numbers of possible discoveries, and their reserves and costs, using the Monte Carlo technique. For the Irish Sea (IS) and West-of-Shetland (WoS), assumptions were made for some of these regions’ variables because of the limited data available over the last five years.
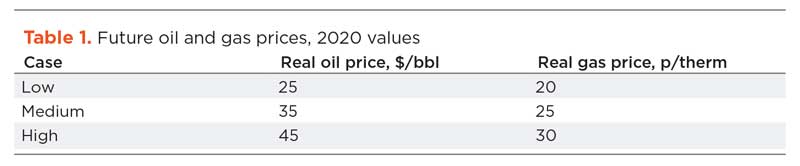
To undertake the modelling, assumptions had to be made regarding future oil and gas prices, $/£ exchange rate, exploration effort, and sizes of future discoveries. The assumptions are discussed in turn. The assumptions regarding future oil and gas prices are shown in Table 1. The exchange rate used was £1 = $1.235. Inflation was assumed to be 2.5%. Thus, in money-of-the-day (MOD) terms, oil prices in 2050 become $52.40 for the $25 price, $73.40 for the $35 price, and $94.40 for the $45 price.
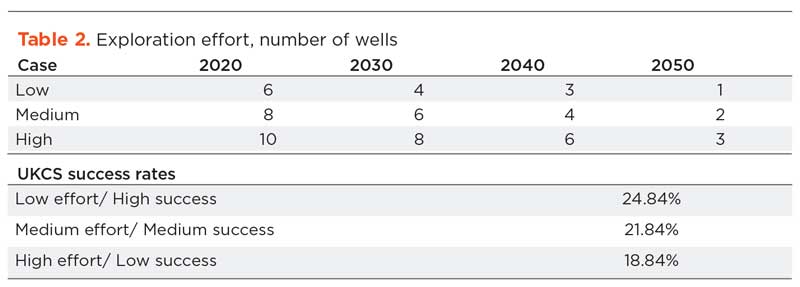
The assumptions regarding exploration effort and success rates over the period are shown in Table 2. The success rate for exploration was assumed to depend on size of the effort and recent experience. Higher effort may yield more discoveries, but the success rate may be lower, if the resulting higher exploration effort is concentrated on higher-risk prospects. This study used three success rates, as shown in Table 2. The success rate in each region varies, depending on the five-year moving average for each region.
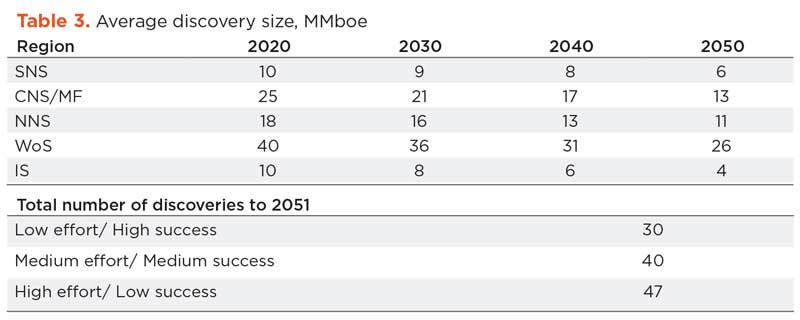
The average size of discoveries in recent years, for each of the regions, was calculated. It was assumed that the average discovery size would decline over time, Table 3. In the Monte Carlo modelling, these values were taken as the mean values of a lognormal distribution. A standard deviation of 50% was then assumed to determine the distribution of sizes of reserves for new exploration finds. The total numbers of discoveries made over the period are shown in Table 3.
Average development costs of the probable, possible and recent new developments were calculated separately for each region. For the UKCS overall, average development costs were $14.24/boe, with a maximum of $24.02/boe. Average SNS development costs were $13.73/boe, compared to $14.43/boe in the CNS/MF area, $12.15/boe in the NNS, $11.62/boe in the WoS, and $17.21/boe in the IS.
Average operating costs for all fields in the above UKCS categories were $8.54/boe. In the SNS, they were $9.09/boe, versus $15.15/boe in the CNS/MF area, and $11.77/boe in the WoS. Average total costs were found to be $25.14/boe on the UKCS. In the SNS, they were $23.54/boe, compared to $31.05/boe in the CNS/MF area, and $25.10/boe in the WoS.
These values were used with the Monte Carlo technique to find development costs of new discoveries from a normal distribution, with a standard deviation of 20%. Annual operating costs were modelled as a percentage of cumulative development costs for the fields found, with the percentage declining as the field size increased to reflect economies of scale.
Given the industry’s physical and financial constraints, it was assumed that there would be a limit on the number of new discoveries that could be developed each year. Thus, a cap on the annual number of new developments was introduced.
It was assumed that the average development costs of the technical reserve fields would be $5/boe higher than the development cost for new discoveries. But it also was assumed that the technical reserves development costs would depend on the size of the reserves, reflecting economies of scale. A formula was devised to assign development costs to each technical reserve field, where the cost assigned depended on 1) the average technical reserve field development cost; and 2) the difference between the reserve size and the average size in the region.
If a technical reserve field was smaller than the average size found in the region, then the technical reserve cost assigned to that field would be higher than the average technical reserve cost for the region. Similarly, if the technical reserve field was larger than the average found in the region, the development cost would be less than the average cost for the region.1 The mean, minimum and maximum values for development costs per boe using this formula are shown in Table 4.
For the UKCS overall, average development costs per boe for incremental projects is $17.68. In the CNS/MF area, they are $12.88, plus $15.88 in the NNS and $27.46 in the SNS. Average operating cost is $9.78/boe. It should be noted that 29 projects reported by operators have no operating costs. Also, among 95 incremental projects, three have no production.
It is highly likely that in future years, more incremental projects will come forward. Using the five-year moving average for costs and reserves of incremental projects, future projections of incremental production and costs have been made.

In this study, the investment hurdle rate used for probable fields, possible fields, new exploration discoveries, technical reserve fields, and incremental projects is: Real Post-tax Net Present Value at 10% / Real Investment cost at 10% ≥ 0.3. For tax purposes, it is assumed that the operator of the sanctioned fields and the associated incremental projects is in an ongoing tax-paying position. However, for all fields in categories of probable, possible, technical reserves, and new exploration finds, it is assumed that the investor is in a project tax position. He thus carries forward his capital allowances and has access to the Ring Fence Expenditure Supplement (RFES).
FIELDS IN PRODUCTION
The $25/20-pence price case. In this scenario, the number of currently sanctioned fields falls rapidly to 33 in 2035, and 10 in 2040. There are two sanctioned fields that begin development in the period. Of 411 technical reserve fields, 398 fail the hurdle. Of 92 incremental projects, 52 fail the hurdle.
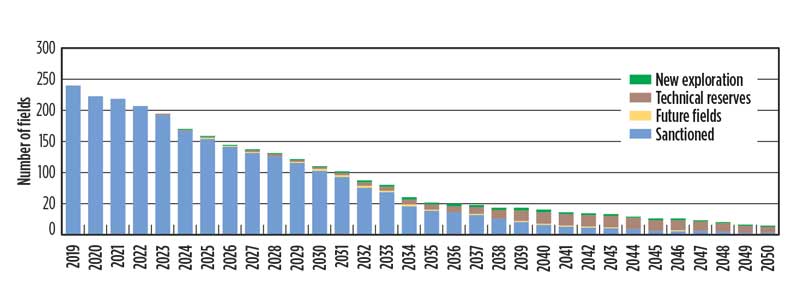
The $35/25-pence outlook. In this case, as shown in Fig. 1, the number of currently sanctioned fields falls to 38 in 2035 and 16 in 2040. There are 38 positive new field developments. Of 411 technical reserve fields, 381 fail the hurdle. Among 92 incremental projects, 43 fail the hurdle.
A $45/30-pence scenario. Under these price conditions, the number of currently sanctioned fields falls to 41 in 2035 and seven in 2045. In total, 83 fields pass the development hurdle. Among 411 technical reserve fields, 355 fail the hurdle. Of 92 incremental projects, 35 fail the hurdle.
PRODUCTION: OIL
A $25 scenario. The results for oil production at the $25 price, during the period to 2050, show cumulative oil production of 4,760 MMbbl. Of that amount, 3,344 MMbbl come from already sanctioned fields. However, fields containing 2,251 MMbbl (more than 32% of all available oil) fail to pass the hurdle. Production declines sharply until 2028, when technical reserve fields begin to contribute to production. In 2050, total production becomes less than 60,00 bopd.
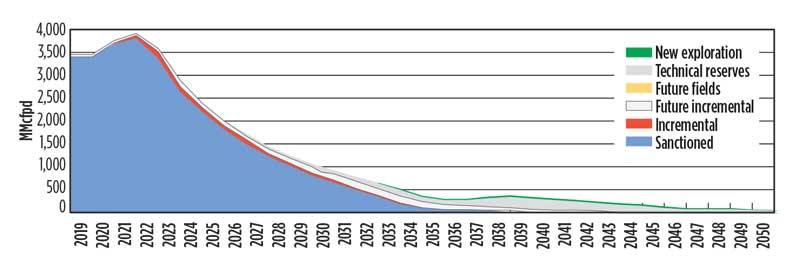
The $35 outlook. The results for oil production at the $35 price are shown in Fig. 2. Over the period to 2050, cumulative, potential oil production is 5,693 MMbbl, of which 3,520 MMbbl come from already sanctioned fields. However, 2,430 MMbbl (which is almost 30% of all available oil) fail to pass the hurdle. Production declines sharply till 2027, when technical reserve fields begin to contribute to production. By 2050, total production is just over 132,000 bopd.
A $45 scenario. For oil at the $45 price, 7,120 MMbbl may be economically produced during the period to 2050, of which 3,603 MMbbl come from already sanctioned fields. However, 1,945 MMbbl (which is more than 21% of all available oil) fail to pass the hurdle. Production declines until 2026, when technical reserve fields begin to contribute to production. During 2050, total production reaches just over 142,000 bopd.
PRODUCTION: NATURAL GAS
The 20-pence case. Over the period, at a 20-pence real price, with the NPV/I ≥ 0.3 hurdle, cumulative gas production of 2,167 MMboe may be economically produced, of which 1,930 MMboe come from already sanctioned fields. However, 1,432 MMboe (which is almost 40% of all available gas) fail to pass the hurdle. With this hurdle rate and the low price, there is no gas production from probable and possible fields and new exploration finds. steeper than the corresponding rate for oil.
A 25-pence outlook. Over the period, as seen in Fig. 3, a 25-pence real price results in cumulative gas production of 2,374 MMboe being economically produced, of which 1,978 MMboe come from already sanctioned fields. Yet, 1,922 MMboe (which is almost 45% of all available gas) fail to pass the hurdle. With this hurdle rate and the medium price, there is no gas production from probable and possible fields.
The 30-pence scenario. During the period, with a 30-pence real price, cumulative gas production to 2050 of 3,065 MMboe may be economically produced, of which 1,994 MMboe come from already sanctioned fields. However, 2,000 MMboe (which is more than 39% of all available gas) fail to pass the hurdle.
DEVELOPMENT EXPENDITURE
The $25/20-pence case. Over the period to 2050, with $25 and 20 pence real prices, annual development expenditure at 2020 prices falls below £1,000 million by 2029. Cumulative development expenditure to 2050 could total £28,934 million, with £19,738 million coming from already sanctioned fields. Field development investment falls to only about £1.5 billion in 2023, and £0.5 billion in 2030.
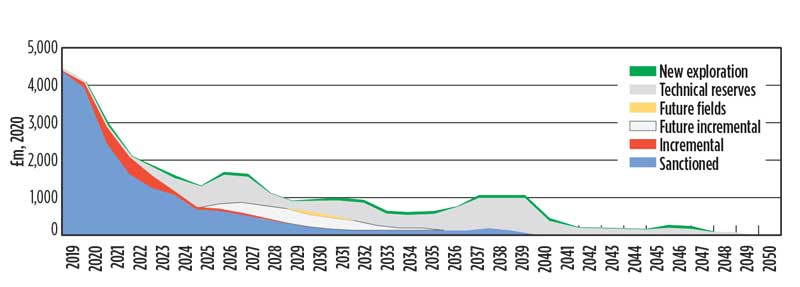
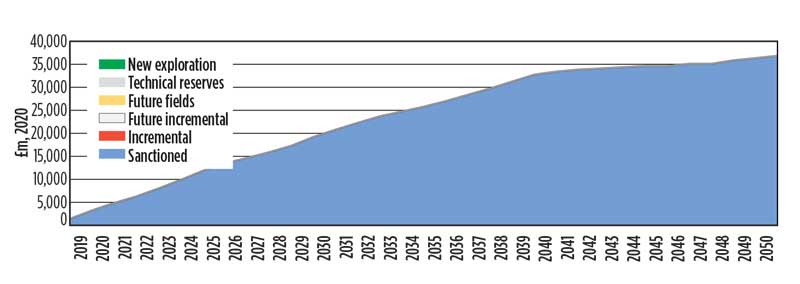
A $35/25-pence outlook. Over the period to 2050, with $35 and 25-pence real prices, annual development expenditure falls below £1,000 m by 2040, Fig. 4. Cumulative development expenditure could total £35,431 million over the period, with £19,759 million coming from already sanctioned fields. Field development investment falls dramatically from 2020 levels, to only £1.8 billion in 2023 and £1 billion in 2030.
The $45/30-pence scenario. During the period to 2050, with $45 and 30-pence real prices, annual development expenditure falls below £1,000 million by 2039. Cumulative expenditure might total £52,809 million, with £19,768 million coming from already sanctioned fields. Field development investment does not fall as dramatically as is the case with the lower prices.
OPERATING EXPENDITURES
Operating expenditures fall sharply at all prices.
The $25/20-pence case. Over the period to 2050, with $25 and 20-pence real prices, cumulative operating expenditures may total £86,339 million, with £77,946 million coming from already sanctioned fields. However, these expenditures could fall to less than £2,000 million per year by 2033. The most obvious feature is the continuous, sharp fall in operating expenditures from billion in 2019 to around £0.3 billion in 2050.
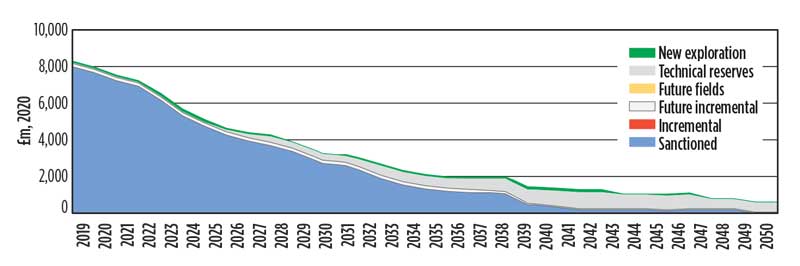
A $35/25-pence outlook. Over the period to 2050, with $35 and 25-pence real prices, as seen in Fig. 5, cumulative operating expenditures may total £98,999 million, with £83,161 million coming from already sanctioned fields. However, these expenditures may fall to less than £2,000 million per year by 2035. An obvious result is the continuous fall in operating expenditures from around £8 billion in 2019 to around £0.6 billion in 2050.
The $45/30-pence scenario. During the period to 2050, with $45 and 30-pence real prices, cumulative operating expenditures could total £121,048 million, with £86,152 million coming from already sanctioned fields. However, these expenditures may fall to less than £2,000 million per year by 2042. Operating expenditures fall from around £8 billion in 2019 to around £1 billion in 2050.
DECOMMISSIONING ACTIVITY
The $25/20-pence case. With $25 and 20-pence real prices, cumulative decommissioning costs could total £37,079 million by 2050, with 98%, or £36,517 million, coming from already sanctioned fields. Around 50% of decommissioning spending will occur before 2029, with 80% occurring before 2038. This outlook reflects a very small number of future developments.
A $35/25-pence outlook. With $35 and 25-pence real prices, cumulative decommissioning costs may reach £37,119 million by 2050 (Fig. 6), with 98%, or £36,258 million, coming from already sanctioned fields. More than 50% of decommissioning spending will take place by 2030, with more than 80% occurring before 2038. Overall costs reflect the small number of new developments.
The $45/30-pence scenario. With $45 and 30 pence real prices, cumulative decommissioning costs could be £38,008 million by 2050, with 95%, or £35,940 million, coming from already sanctioned fields. More than 50% of decommissioning spending will occur by 2030.
NUMBER OF FIELDS BEING DECOMMISSIONED
The $25/20-pence case. With $25 and 20-pence real prices, there will be 144 fields either engaged in or having completed decommissioning by 2025. By 2030, the aggregate number becomes 207, and by 2050, there will be 319 fields either engaged in or having completed decommissioning, including 311 sanctioned fields.
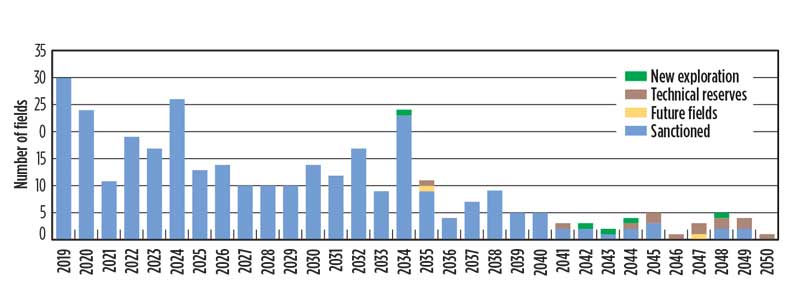
A $35/25-pence outlook. With $35 and 25-pence real prices, there will be 140 fields either engaged in or having completed decommissioning by 2025, Fig. 7. By 2030, the aggregate number is 198, and by 2050, there will be 332 fields either engaged in or having completed decommissioning, including 312 sanctioned fields.
The $45/30-pence scenario. With $45 and 30-pence real prices, there will be 126 fields either engaged in or having completed decommissioning by 2025. By 2030, the aggregate number will be 188, and by 2050, there will be 371 fields either engaged in or having completed decommissioning.
SUMMARY AND CONCLUSIONS
This study has examined the prospects for activity on the UK Continental Shelf (UKCS) following the dramatic collapse in oil and gas prices. The economic modelling has been undertaken with oil prices of $25, $35 and $45 in real 2020 terms and corresponding gas prices of 20 pence, 25 pence and 30 pence, again in real terms. These prices increase yearly at an inflation rate of 2.5% p.a. Thus, the $25 price in MOD terms becomes $52.4 in 2050, the $35 price becomes $73.4, and the $45 price becomes $94.4. The modelling and results cover the 2019–2050 period.
It is clear that total production declines sharply over the period, especially for sanctioned fields, and the decline is faster at the lowest prices. The decline rate is sharper for gas output than it is for oil production.
Operating expenditures fall sharply at all prices. With lower prices, fields become uneconomic earlier, and so decommissioning occurs earlier. Fields cease production before they are fully depleted, and the lower the price, the higher decommissioning costs are as a percentage of total costs. Brown field investment and near-field small discoveries may be lost, once a potential host field is decommissioned. With companies and government facing a cash shortfall, it’s likely that both groups may prefer to delay decommissioning.
This study uses costs, as they were before the effects of the Covid-19 crisis were fully understood. Given current restrictions on travel and social distancing rules, it is likely that some costs will increase. The UKCS future, at the oil and gas prices employed in this study, depends critically on technological innovations that can enhance productivity significantly.
REFERENCE
- For a more detailed explanation see A.G. Kemp and L. Stephen, “The Potential Contribution of Cluster Developments to Maximising Economic Recovery in the UKCS”, North Sea Study Occasional Paper No. 144, University of Aberdeen Business School, July 2019, pp. 167 https://www.abdn.ac.uk/research/acreef/working- papers/
- Management issues- Dallas Fed: Activity sees modest growth; outlook improves, but cost increases continue (October 2023)
- Industry at a glance (June 2023)
- Industry at a glance (May 2023)
- Management issues- Dallas Fed: Oil and gas expansion stalls amid surging costs and worsening outlooks (May 2023)
- Industry at a glance (March 2023)
- The last barrel (February 2023)
- Applying ultra-deep LWD resistivity technology successfully in a SAGD operation (May 2019)
- Adoption of wireless intelligent completions advances (May 2019)
- Majors double down as takeaway crunch eases (April 2019)
- What’s new in well logging and formation evaluation (April 2019)
- Qualification of a 20,000-psi subsea BOP: A collaborative approach (February 2019)
- ConocoPhillips’ Greg Leveille sees rapid trajectory of technical advancement continuing (February 2019)

