U.S. drilling wanes, trend predicted to continue in second half
The substantial ramp-up in U.S. shale drilling activity, that started in January 2018 is staring to wane, despite production cuts by Saudi Arabia and Russia that have supported crude prices during the last 12 months. Years of costly drilling, and highly questionable buying sprees, have gutted shareholder returns of large- and mid-sized shale producers. To stave off further deterioration of stock prices and dwindling investor returns, operators are divesting marginal properties and turning to M&A to consolidate their positions and reduce competition. One major U.S. independent formed a JV with a South American company to help develop its Midland basin acreage. The deal netted a $750 million cash infusion, but cost the company 49% of its 97,000-net-acre leasehold in the play.
MACRO U.S. PICTURE
The Baker Hughes rotary rig count stood at 904 active units during the week ending Aug. 30, 2019. That total is 2% less, or just 20 rigs fewer than were working in Jan. 5, 2018, Fig. 1. But compared to the peak shale-surge tally of 1,068 reached the week of Oct. 26, 2018, the current count is 15% less, indicating that Wall Street’s pursuit of U.S. shale companies to prioritize investor returns over growth is driving some U.S. producers to pause. Weaker global demand, caused by the unrelenting trade dispute between the U.S. and China, is taking a long-term toll on crude prices. Downward pressure is also being applied by a contracting U.S. manufacturing segment. To offset weaker market fundamentals, Saudi Arabia continued to play the role of swing producer, reducing production steadily after reaching an all-time high of 11.09 MMbopd in Nov. 2018, to 9.58 MMbopd in July 2019. Despite the plethora of negative news, U.S. capital expenditures are forecast to contract just 2.5% from 2018 levels. But the decline could be at risk of falling further, if WTI and HH continue on a downward trajectory. This is the first U.S. spending contraction since 2016. On a positive note, the U.S. Gulf of Mexico is seeing a pickup in activity, with BP sanctioning Thunder Horse South 2 and Atlantis Phase 3.
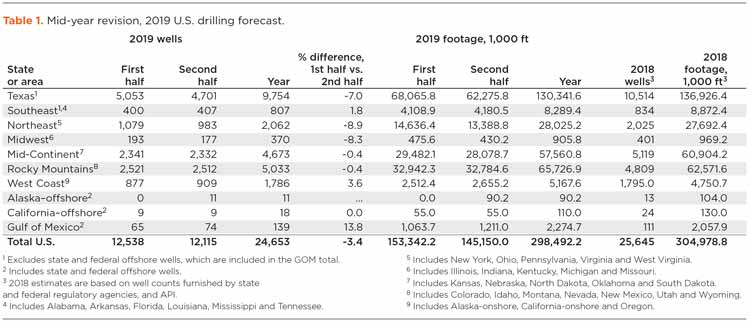
Overall forecast. Against this backdrop, World Oil forecasts a slight drilling slowdown for the remainder of the year, projecting 24,653 total wells for 2019—a 3.4% reduction from the 2018 count of 25,645, Table 1. Total footage is projected to decline from 304.9 MMft in 2018 to 298.5 MMft in 2019—a decrease of 2.1%. During 2019, 12,538 wells are estimated to have been drilled during the first six months, while 12,115 are expected to spud in the second half of the year, for a half-to-half decline of 3.4%. A 5.3% decrease in footage is expected in the last six months.
The modest decline in drilling activity suggests the U.S. E&P industry is finally pausing to reassess its assets and allow additional pipeline infrastructure to be built in West Texas to more efficiently move product to market. However, the boom in crude output is masking problems at virtually all shale producers, and the OFS sector in general. Energy-related bankruptcies are up this year, and some companies are warning of more stress ahead. Schlumberger, Halliburton, NOV and Baker Hughes’ stock prices are down 48%, 52%, 56% and 31%, respectively, over a one-year period, and Weatherford filed for bankruptcy July 1. The distress is caused mainly by operators that will not pay OFS companies sustainable prices for tools and services. And it’s not just the OFS sector either. In August this year, Concho Resources stock plummeted 22% to close at $75.97 for its biggest one-day drop since 2008, wiping out almost $4.4 billion of market value. Oklahoma City-based Continental Resources has lost $15 billion of market capitalization since October. And shares of other shale producers have also taken a beating, as investors grow impatient with the shale sector’s track record of burning cash without producing enough returns. The S&P index of independent explorers has tumbled 51% since early October.
In spite of these losses, activity in the Permian and other shale plays continues at a blistering pace. The unrelenting drive by shale companies to tap their “undeveloped” acreage, has led to a growing number of DUCs. As of July 2019, operators working the U.S. shale plays have managed to archive 8,108 DUCs, with 51% of that total in the Permian basin (EIA). That’s a significant amount of stranded capital. Realistically, it will take several years to pare-down the 8,108-well logjam, and the extended down-time could damage boreholes and hurt project economics. And some wells may never be completed. Appalachia is the only region to have a meaningful reduction in DUCs over the last year, with backlogged wells dropping 44% to 422, as of July.
At World Oil’s 2019 forecast breakfast held in late January, James West, senior managing director at Evercore ISI, said, “operators have spent $1 trillion developing U.S. shale plays but have returned only $750 billion. Although several international consulting firms have suggested that the DUCs are dropping or irrelevant, the drastic reduction in stock prices, bankruptcies and consolidations, combined with consistently firm data reported by the EIA, suggest otherwise.
However, operators must continually drill wells to remain profitable, and although unlikely, a crude shortage could push prices higher. In July and August, supply disruption risk increased, when escalating hostilities between the U.S. and Iran led to two oil tanker attacks and a downed U.S. surveillance drone.
In any case, it appears that the U.S. E&P industry will undergo a significant change over the next several years, especially in the shale plays. Independent producers in the Permian basin are trading much lower than when Chevron and Oxy bid for Anadarko in April. Shell and ConocoPhillips have expressed interest in purchasing shale at the right price. ExxonMobil CEO Darren Woods said his company is keeping a “watchful eye” on the Permian for potential deals. Against the backdrop of these flashing warning signals, World Oil cautiously presents its 2019 midyear forecast for the U.S.
North American capex set for modest reduction. With the seeds of another bust starting to germinate, North American E&P capex is projected to decrease just 3% in 2019, according to the 2019 Global E&P Mid-Year Spending Outlook from Evercore ISI. The definitive report authored by James West is gathered from a twice-yearly survey and released in July. The Evercore report goes on to say that after two strong years of double-digit growth, spending is expected to contract 2.5% in the U.S., down from a projected 10.6% growth in their initial survey. Spending in Canada is expected to contract 8.3%, down from 5.1% growth in Evercore’s initial survey, erasing the 8.1% growth experienced in 2018. Based on the anticipated 2020 spending plans in Evercore’s mid-year survey, NAM spending could increase another 12%, based on average oil prices of $58 and HH natural gas prices of $2.65/MMBtu. This would bring spending back to almost double the 2016 trough, but still 40% from the 2014 peak. However, Evercore believes, that given risks for the second-half of 2019 and into 2020, NAM spending is more likely to shrink, evidenced by macro growth uncertainty and commodity prices volatility.
Overall, it has been a challenging year for North America, which Evercore characterizes as “grinding along.” Evercore forecasts that the industry will be impacted by budget exhaustion in 2019, similar to the end of 2018. NAM shale remains a commoditized and fragmented business. In this environment, North American OFS companies have shown some discipline by stacking equipment that is not earning an adequate return or moving it to more active basins.
COMMODITY PRICES/OUTPUT
The well-publicized production cuts by Saudi Arabia and Russia had a beneficial impact on oil prices during the first-half of 2019, despite surging output from U.S. shale fields. The gusher of crude pushed U.S. output to an all-time high of 12.24 MMbopd, in May of this year. Saudi Arabia quietly returned to the roll of swing producer during the first half of 2019, reducing overall output by 660,000 bopd, from January to July. Russia reduced its production 230,000 bopd during the same seven-month period.
The supply restriction had a positive effect. During fourth-quarter 2018, WTI and Brent averaged $59/bbl and $68/bbl, respectively. However, downward pressure created by the on-going trade war between the U.S. and China restricted benchmark prices, so commodity prices remained stable through the first quarter of this year, with WTI trading between $50/bbl and $58/bbl from December 2018 to March 2019. Brent varied from $57/bbl to $66/bbl during the same period.
With Saudi Arabia and Russia adhering to reductions, prices remained stable in the second quarter of 2019, with WTI averaging $60/bbl, and Brent trading for $69/bbl. By the end of July, benchmarks dipped slightly, with WTI trading at $57/bbl and Brent at $64/bbl. The price difference between WTI and Brent is partially due to the higher shipping costs required to move product from Midland to the Gulf Coast.
Short-Term Energy Outlook. The EIA’s STEO analysis, published August 2019, reported that Brent spot prices averaged $64/bbl in July, virtually unchanged from the average in June 2019, but $10/bbl lower than the price in July of last year. EIA forecasts Brent spot prices will average $64/bbl in the second half of 2019 and $65/bbl in 2020. The forecast of stable crude oil prices is the result of EIA’s expectations of a relatively balanced global oil market. EIA forecasts global oil inventories will increase by 0.1 MMbpd in 2019 and 0.3 MMbpd in 2020.
The EIA expects WTI to average $5.50/bbl less than Brent during the fourth quarter of 2019 and in 2020, narrowing from the $6.60/bbl spread during July. The closing price gap reflects EIA’s assumption that oil pipeline transportation constraints from the Permian basin to refineries and export terminals on the U.S. Gulf Coast will ease in the coming months.
The EIA estimates that U.S. oil production averaged 11.7 MMbpd in July, down 0.3 MMbpd from the June level. The declines were mostly in Federal GOM waters, where operators shut platforms for several days in mid-July because of Hurricane Barry. EIA estimates that GOM crude oil production fell by more than 0.3 MMbpd in July. Those declines were partially offset by the Lower 48 onshore region, which is mostly tight oil production, where supply rose by more than 0.1 MMbpd. Monthly growth in Lower 48 onshore production is forecast to slow, averaging 50,000 bbl/month from the fourth quarter of 2019 through the end of 2020, down from an average of 110,000 bbl/month from August 2018 through July 2019. EIA forecasts U.S. crude oil production will average 12.3 MMbpd in 2019 and 13.3 MMbpd in 2020, both of which would be record levels.
Natural gas prices. The Henry Hub natural gas spot price averaged $2.37/MMBtu in July, down $0.03/MMBtu from June. However, by the end of the month, spot prices had fallen below $2.30/MMBtu. Based on this price movement and EIA’s forecast of continued strong growth in natural gas production, EIA lowered its HH spot price forecast for the second half of 2019 to an average $2.36/MMBtu. In the July STEO, EIA expected prices to average $2.50/MMBtu during this period. EIA expects natural gas prices in 2020 will increase to an average of $2.75/MMBtu. EIA’s natural gas production models indicate that rising prices are required in the coming quarters to bring supply into balance with rising domestic and export demand in 2020. However, the market appears to believe producers may overshoot demand growth, particularly considering major infrastructure additions scheduled for 2019 and beyond. As such, pricing expectations remain relatively subdued.
Natural gas production. EIA forecasts that U.S. dry natural gas production will average 91.0 Bcfd in 2019, up 7.6 Bcfd from 2018. EIA projects monthly average natural gas production to grow in late 2019 and then decline slightly during the first quarter of 2020, as the lagged effect of low prices in the second half of 2019 reduces natural gas-directed drilling. However, EIA forecasts that growth will resume in the second quarter of 2020, and natural gas production in 2020 will average 92.5 Bcfd.
EIA estimates that natural gas inventories ended July at 2.7 Tcf, 13% higher than levels from a year earlier and 4% lower than the five-year (2014–2018) average. EIA forecasts that natural gas storage injections during the 2019 April-through-October injection season will outpace the previous five-year average and that inventories will rise to more than 3.7 Tcf at the end of October, which would be 16% higher than October 2018 levels and slightly above to the five-year average.
LNG exports. Natural gas deliveries to U.S. facilities producing LNG for export set a monthly record in July 2019, averaging 6 Bcfd)—7% of the total U.S. dry natural gas production—according to data from OPIS PointLogic Energy. In the first seven months of 2019, natural gas feedstock deliveries to LNG export facilities have been the fastest-growing among all U.S. natural gas consumption sectors.
Gas delivered by pipelines to Mexico and to U.S. LNG export facilities reached 10.9 Bcfd in July and averaged 10.0 Bcfd in the first seven months of this year, 30% more than in the same period of 2018. U.S. LNG exports set new records in June and July 2019 at 4.8 Bcfd and 5.2 Bcfd, respectively, based on tanker loadings data from Bloomberg. Two new LNG export facilities—Elba Island LNG in Georgia and Freeport LNG in Texas—plan to place their first trains in service in the next two months.
Oilfield service companies. Evercore estimates overall services pricing fell 20%-70% from the 2014 peak to trough, depending on the service or product line, geographic location and service provider. Pricing recovered about 15% off the bottom, as of our mid-year 2017 survey, and increased another 15% year-over-year through our mid-year 2018 survey. But this appears to have stalled over the past year. While the majority of Evercore’s survey respondents claim to have experienced no change in service costs over the past year, one-third have experienced pricing declines and an equal one-third have experienced pricing increases. Given the recent decline in oil prices, Evercore forecasts service-cost inflation will decline further over the next six months.
U.S. FORECAST
Given the potential for further oil price declines, combined with a large inventory of DUC wells in the major U.S. shale basins, operators working the various plays plan to slightly reduce drilling activity for the remainder of 2019. As expected, the Permian will remain a major target for companies seeking to add oil reserves. However, operators in Oklahoma plan to drastically reduce drilling activity due to disappointing results in the state’s STACK and SCOOP plays. Offshore drilling will experience a slight resurgence.
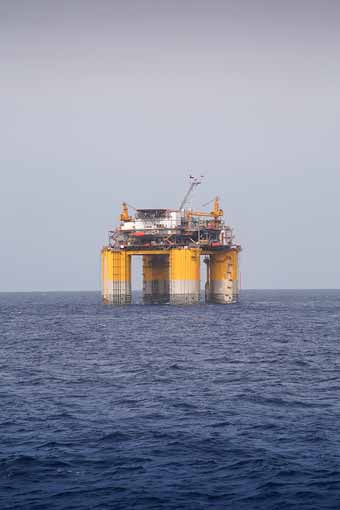
Gulf of Mexico. With the limitations of the unconventional plays becoming more apparent, operators plan to increase drilling during the Gulf of Mexico in the second half of the year. Evercore says the offshore industry is in the midst of a two-year recovery, and spending is projected to accelerate in 2019, Fig. 2. Offshore rig utilization bottomed in early 2017, for both the shallow-water and deepwater segments, due to higher utilization driven by rig attrition and a rebound in drilling activity. According to World Oil’s survey results and federal officials’ outlook, well counts will start to recover during second-half 2019. World Oil forecasts that GOM activity totaled 65 wells in the first half of the year, with another 74 scheduled to be drilled in the second half of 2019. The projected 139-well total will be 25% higher than the 2018 figure of 111.
Talos Energy released details on two wildcat strikes in its Bulleit and Orlov prospects in Green Canyon, deepwater GOM. The Bulleit prospect discovered 140 ft of net TVD oil sand in its shallow target and 110 ft of oil pay in the deeper MP sand. The Orlov prospect encountered 100 ft of net oil pay, as well as additional pay in shallower zones along the same trap.
STATE-BY-STATE OUTLOOK
Texas. The shale plays continue to be the focus in the Lone Star State, with a high concentration of activity focused in the districts that contain unconventional formations. The level of activity in the Permian basin and Eagle Ford shale pushed oil production in Texas up to 5,261 bopd in June, an 11% y-o-y increase. However, the relentless drive to stack multiple wellbores into ever shrinking sweet spots has resulted in a DUC count in the Permian of 3,999 as of July. The idle Texas wellbores account for 49% of the total U.S. tally of 8,108. To help reduce the accumulation, companies plan to reduce activity 8% in District 8, and 11% in District 7C, on a half-to-half 2019 basis. Despite a fewer number of wells, the drive for ever longer laterals will keep footage in District 7C unchanged, and just 2% lower in District 8 during 2019 vs. 2018.
The shale plays also increased natural gas production in the state. The increased volume has led to bust scenarios in Districts 3, 4 and 10, which we predict will suffer 19%, 19% and 57% declines in drilling activity, respectively, y-o-y. District 8A and 7B will experience an increase, with well totals increasing 15% and 12% on a half-to-half 2019 basis. Total combined activity in the state will decrease 7.2% in 2019, with footage down 4.8%.
On a positive note, two new oil pipelines intended to alleviate transportation issues, by connecting the Permian to Corpus Christi, went online in August. The Epic Midstream project started delivering 400,000 bopd, while 670,000 bopd is now being pumped to the Gulf Coast through All American’s Cactus II Pipeline. The EIA reported that the 2-Bcfd Gulf Coast Express Pipeline (GCX) is preparing to enter service. The pipeline will provide much-needed additional natural gas takeaway capacity from the Permian and southeastern New Mexico. The news caused gas prices at the Waha hub to surge upward, settling at $1.55/MMBtu on August 15, the highest price since March 2019.
Oklahoma. Although the SCOOP and STACK areas were touted as the next big shale play, many producers are warning that the region’s inconsistent geology has increased costs and is undercutting results. Alta Mesa Resources reported that its $3.8-billion investment is now worth about $30 million. The loss was incurred in just two years, and last month the company said it may not be able to pay creditors. Others downsizing including Devon, which cut capital spending earmarked for its STACK position to 20% of its total spend in 2019, down 11% from 31% in 2018 (Reuters). Another disappointment has been poor results from secondary wells (child) that produce less oil than the original (parent). Based on these facts, it’s no surprise that Oklahoma’s drilling for 2019 will be down 15% compared to 2018, with second-half vs. first-half activity for 2019, dropping 18%.
Louisiana. In the northern portion of the state, operators developing the Haynesville shale gas play will drill virtually the same number of wells in 2019 (500), as they did in 2018 (497), although total footage will decrease 5%. With natural gas prices under pressure from excess supply, the slight increase in activity suggests operators are still able to secure a reasonable ROI in the mature area. In southern Louisiana, activity is slowing with footage forecast to decrease 5%, and well spuds dropping 3%.
North Dakota. Transportation issues associated with the remote location of the oil-rich Bakken play have hampered recovery of the region since the 2016 bust. Development costs associated with drilling 11,000-ft laterals are also a suppressing factor, with some wells reaching an MTD of 21,000 ft. However, based on data from state officials and our own survey, World Oil forecasts that drilling will increase 1%, with footage up 1.1%.
Northeast (Pa./W.V./Ohio). In the Northeast, activity in the Marcellus is still driving activity but at a slower pace. Dominion Energy’s Cove Point LNG facility shipped its first cargo in March 2018, which should keep activity in the region steady for the next several years. The massive $4-billion investment speaks volumes about the sustainability of natural gas production in the region. According to survey results, operators tapping the high-quality reservoir in Pennsylvania will drill the same number of wells this year (1,106) as in 2018. Total footage for 2019 is forecast to remain unchanged, as well.
In West Virginia, World Oil forecasts a noticeable gain of 12.8% in drilling activity, with a 14% increase in total footage. This tread suggests that operators are seeking to identify and exploit sweet spots in the Mountain State, as acreage in Pennsylvania is reaching optimal development. It is interesting to note that Appalachia is the only U.S. shale play to show a major reduction in DUCs y-o-y, with a 44% decrease as of July 2019 (EIA). This trend documents a responsible allocation of drilling capital, which is unique to the U.S. shale plays. In Ohio, operators working the Utica play are struggling, with this year’s total well count expected to finish 6% lower than last year’s level. Footage also is forecast to drop 6%, too.
Rocky Mountains. Legislation in Colorado reached a deafening crescendo in 2019, with state officials seeking to ban, or severely limit, drilling activity in the state. Fortunately, Prop 112 failed in Colorado, but the state passed a watered-down version in Senate Bill 118 on April 3, “which fundamentally altered the oil and gas industry’s future in the state,” according to Colorado Governor Jared Polis. Despite the dangerous precedent, World Oil expects operators working the Niobrara in the Centennial State to actually increase drilling by two wells, up to 1,675 in 2019, while footage is projected to grow 1%.
In March, a federal judge ordered a halt to exploration on 300,000 acres in Wyoming, saying the government must account for its cumulative effect on global climate change. The ruling came in a lawsuit filed by a pair of environmental conservation groups challenging the BLM’s decision to lease federal lands for energy development in the Equality State. But similar to its neighbor to the south, the legislation has not dampened operators, and activity in the state is projected to surge 8% in 2019, with footage projected to climb 8%.
Although New Mexico was late to join the Permian shale boom, that situation started to change in 2017-2018 and will continue to increase during 2019. As completion efficiencies are increased in the Bone Springs formation in the southeastern portion of the state, the Land of Enchantment should reap an annual 8% gain in drilling activity in 2019, and a 10% uptick in footage.
In California, we expect onshore operators to spud 2% fewer wells in 2019 compared to 2018. With no new discoveries, operators working the Golden State are forced to survive by maintaining mature fields and residual acreage of previous successful excursions. These facts, combined with downward pressure on oil prices, should cause a 6.2% decline in onshore footage. Offshore California, we expect a 25% decrease in activity and a 15.4% reduction in total footage. The situation in the state has deteriorated to the point where virtually all activity is conducted by just four companies. Despite the slowdown, operators pumped 468,000 bopd in July, just 2% less than one year ago.
Big changes are in store for Alaska, after BP sold all its upstream business in the state to Hilcorp for $5.6 billion in August. Although it’s still early in the transition, onshore activity on the North Slope is projected to increase 15.4%, with total footage increasing 17.8%. Offshore work in the Cook Inlet will plummet 15.4%, with just 11 wells forecast for 2019, two less than spud in 2018. WO


- Driving MPD adoption with performance-enhancing technologies (January 2024)
- Rig electrification drives down emissions, bolsters efficiency while improving onshore drilling economics (October 2023)
- Wellbore seal control and monitoring enhance deepwater MPD operations (October 2023)
- Advancing casing drilling to deepwater: Rethinking top hole well construction (August 2023)
- Mobile electric microgrids address power demands of high-intensity fracing (July 2023)
- Utilizing electronic data captured at the bit improves PDC design and drilling performance (July 2023)

