High frequency amplitude volume technique enhances seismic interpretation
Attempting to solve complex reservoir characterization issues, using basic technologies, is no longer feasible in today’s economic environment. To justify new drilling projects, every stage of the decision-making process must incorporate innovative procedures that improve the design of evaluation methodologies and reservoir characterization.1
Although traditional seismic imaging is a powerful tool that can be used to visualize architectural elements of the subsurface, in many cases, it does not fully explain geological intricacies necessary to find and exploit hydrocarbon reserves. When processing seismic information, it is important to conceptualize realistic models. A rational combination of theoretical elements must be used to establish a stable process for attribute generation and interpretation.
To obtain reliable seismic results, geoscientists must consider geological plausibility and take into account that there is no single process or workflow that is universally applicable to generate the best results.
NEW SEISMIC SOLUTION
To solve these issues, a new generation of seismic technology was launched that enables geoscientists to identify subtle geological characteristics that hold residual oil and gas in the reservoir. The new technology, called high-frequency amplitude volume technique (AVThf), works by increasing frequency content and involves co-visualization of two or more seismic attributes. AVThf, as part of an interpreter’s suite of tools, helps geophysicists make more-informed assessments of fault configurations, horizon continuity and stratigraphic descriptions.
Upgrading the static model. It is essential that seismic data recognize and isolate seismic facies associated with the reservoir of interest. It is also important to identify and analyze the lateral and vertical ensemble within their geologic context.
The current suite of interactive software allows the interpreter to establish a workflow to create a robust static model. The model consists of faults, horizons and attributes that describe characteristics, such as channels and carbonate reefs that are propagated throughout the entire model. The information input derived from the model should be consistent with the geology. It is critical to recognize different orders of faults, unconformities, seismic stratigraphic features (truncations), subtle structures and intrusive bodies.
Choosing the type of attribute to be incorporated into the interpretation process is key when searching for geometric or seismic definitions. This process increases the power and scope of the analysis. In this way, attributes linked to amplitude volume techniques (AVT) provide additional perspective to further define the static model and its spatial characteristics.2
The AVThf attribute, which is a variant of AVT, contains extended bandwidth, toward low and high frequencies. These characteristics can magnify and complete those features that would otherwise been truncated or have been poorly defined to be completely recognized. For example, when defining stratigraphic or combination-type subtle traps, this variant has proven to be a useful tool for detailed analysis of thin beds, tuning effects and the definition of geo-bodies.2
An additional issue for consideration is the selection of the appropriate color bars for attribute representation. This is important to accurately identify complex geological columns or abrupt changes in the lithology of subsurface stratigraphic sequences. The AVT images and their variants have visual characteristics that impact the conceptual and dynamic elaboration of the structures present in the subsurface. They can also highlight certain minor features that are part of a seismic reflector’s geometry, such as changes in lateral polarity or small disruptions in continuity.
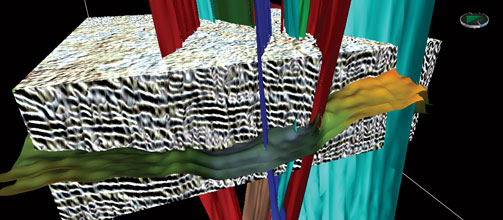
The enhancement of local inconsistencies or disruptions in the continuity is one of the basic objectives of the AVT technique. Visually, the result of this attribute processing has the characteristic of showing the seismic sections with a similar appearance to an outcrop or weathered profile, revealing a pseudo-relief between the more-and-less resistant lithologies, depending on the illumination of the color bar used in its representation. This virtual sensation often strengthens the analysis and understanding of the geometric relationships between different geological events in the Golfo San Jorge basin, Argentina, Fig. 1.
Enhancing seismic definition. One of the biggest problems that an interpreter can encounter is insufficient seismic resolution. This impacts the definition of the architecture of the facies under study, and the ability to understand its internal arrangement. As such, reduced resolution is an issue that must be overcome.
The loss of definition is more apparent at higher frequencies, as data is absorbed more quickly, resulting in a narrower spectrum. This implies a drop in the level of available resolution. The implications of the “quarter wavelength” criterion to resolution should be addressed, since seismic resolution involves both the quantitative and qualitative aspects of the data. While some special attributes improve the focus and further define details of the bodies, it is possible to partially recover the loss of high frequencies. It is important to perform any advanced processing with utmost care to avoid the generation of seismic artifacts that are the product of the associated mathematical calculation.
The loss of high frequencies is related to the depth of the targets. This is where some bodies sink below the limit of seismic resolution, becoming sub-seismic events. This problem is more severe in compact lithologies and carbonates that have higher velocities and therefore are more adversely impacted by the tuning manifested in a smaller thickness of time. Generally, through the process of frequency enhancement, the uncertainty in interpretation is reduced and, to a certain extent, areas of weak reflections may show better continuity.
The improvement of seismic data through the restoration of frequencies, will incrementally improve resolution. For example, subtle geometries and truncations of certain geo-bodies that have, in their extremes, sub-seismic expression, will be more readily recognized. Another application is using the technique to improve the visualization of subtle structures affected by low-frequency noise. The interpreter should decide how high a frequency can be useful for the stated goal. Different basins and areas tend to express different behaviors, so it is important to include knowledge of the geology to determine the reasonable limits.
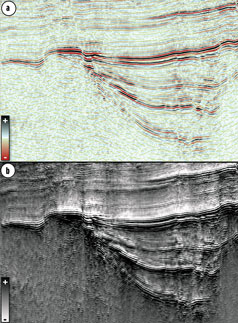
Figure 2 shows the restoration of frequencies, using standard 3D seismic data in the Vaca Muerta formation in Neuquén basin, Patagonia, Argentina. Figure 2a is a standard interpretation of the seismic data. The inset at the bottom right is a time slice in a perpendicular section. Figure 2b is the same seismic time slice extracted from the high-frequency data. This high-frequency restoration is used to delimit the geo-mechanical attributes, to define sweet spots in unconventional reservoirs.3
Multiple co-visualization. Another fundamental concept that reinforces the interpretation is the simultaneous combination of algorithms. The results obtained define the meta-attributes. The increase in bandwidth of AVT is the characteristic that yields a more robust solution. In this case, the most negative curvature (MNC) attribute improves the definition of geometric features on a surface. It can be applied to the calculated AVT samples, generating the meta-attribute Curv (AVThf).4
The attribute above may be understood as a measure of the subtle lateral and vertical changes, increasing with dip, that are generally overshadowed by major regional deformations. This operation results in an enhancement of the geometric alignment of events that other attributes do not identify. The calculation of coherence with a small vertical window emphasizes smaller features, which have been titled Coh(AVThf) and its important interpretive utility.
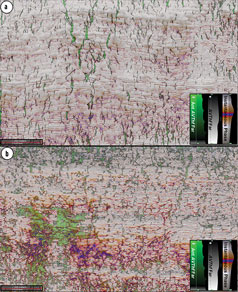
Co-visualization is a powerful tool when looking for the enhancements that can provide details and relationships to highlight events and their geometries. This feature enhances the response of the attributes, either presented with geometric attributes or other special seismic processes, allowing for an enriched view of the subsurface.
The analysis, through the co-visualizations of multiple and different attributes, have been seen to provide a new perspective of the data and a robust alternative when defining the geometries, characteristics and evolution of the structures and their association with potential traps. Additionally, they aid in focusing and orienting, in many cases, the results of the seismic characterization. The perspective of the study is thus sharpened, resulting in an improvement in the definition of stratigraphic and structural architectural elements, especially in comparison with more conventional methodologies of analysis.5
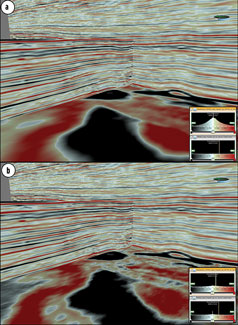
Figure 3 shows the attributes of co-visualization and how it enhances the understanding of the subsurface model. In this case, Fig. 3a is the standard interpretation, while Fig. 3b is the same seismic time line, extracted from high-frequency data. The new rendering enabled geoscientists to recognize associated stratigraphic-structural features that contribute to the construction of the static model for reservoir characterization of 3D seismic data shot in Golfo San Jorge basin, Argentina.6
CONCLUSIONS
When planning an interactive interpretation, decisions should enable interpreters to optimally leverage seismic attributes. Combinations of attributes designed for specific calculations within a model can lead to a greater understanding of the seismic data. The tendency to follow a habitual pattern often leads to incomplete visualizations. By breaking these rigid patterns, solutions will be more accurate, highlighting alternative and creative methodologies.
Interaction between the interpreter and the multidisciplinary team is critical to forming an integrated data set. The consistency of the events in seismic interpretations, used to define amplitude anomalies for example, increases the likelihood of the plausibility in delineating intrinsic characteristics of the reservoir. In the case of non-conventional reservoirs, when analyzing the different attributes and their interrelations, it is possible to identify and reinforce their heterogeneous character. The seismic response to the reservoir’s geo-mechanical properties may also be expressed in the distribution of events and as swarms of small fractures. Combining attributes improves the interpreter’s ability to enhance geometrical definition.
Some of the multiple attributes and co-visualizations have proved to be powerful organizers of architectural elements of seismic facies. The relationship between them offers the possibility to visualize, interpret and, in many cases, increase the evidence of certain characteristics that are often subtle in isolation, but significantly linked when they relate to each other.
The extraction of geo-bodies from these attributes can be incorporated in the static modeling of the reservoir. It is also important to more clearly identify the distribution of brittle and ductile zones, crucial to optimized hydraulic fracturing and stages of stimulation. ![]()
ACKNOWLEDGEMENTS
The authors would like to thank Pan American Energy LLC for permission to publish the seismic examples in this presentation. Also, thanks to Scott MacKay for reviewing the manuscript and to Ignacio Rovira for his technical contributions.
REFERENCES
- Chopra S., S. Singleton, G. Hall, R. Nickerson and D. Carlson, “Integrated reservoir characterization - a successful interdisciplinary working model,” CSEG National Convention, May 10–13, 2004, pp. 1–6.
- Vernengo, L. and E. Trinchero, “Application of amplitude volume technique attributes, their variations and impact,” SEG, The Leading Edge, Oct. 2015, pp. 1246–1253.
- Trinchero, E., L. Vernengo, and J. Cardoso, “Geomechanical and geometric seismic attributes in interpretation workflow for characterization of unconventional reservoirs,” SEG, The Leading Edge, April 2013, pp. 386–392.
- Marfurt, K., V., A. Sudhaker, K. Gerztenkorn, Crawford, and S. Sielsen, “Coherency calculations in the presence of structural dip,” Geophysics, 64, Jan.–Feb. 1999, pp. 104–111.
- Vernengo, L., E. Trinchero, M. García Torrejón and I. Rovira, “Interpreting seismic amplitude volume technique attributes,” AAPG Explorer, April 2017, pp. 22–25.
- Chopra, S. and J.P. Castagna, J. P., AVO Investigations in Geophysics Nº 16, SEG, Society of Exploration Geophysicists, 2014.

