Industry at a Glance
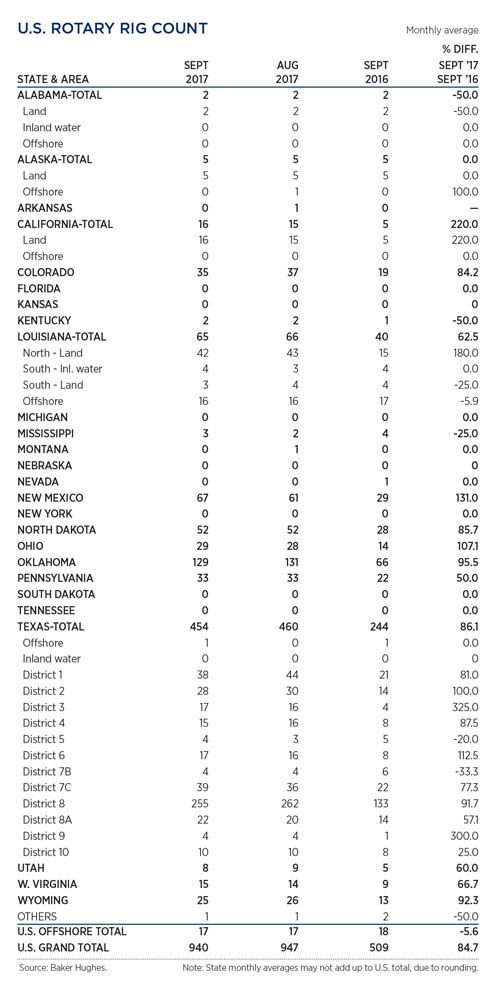
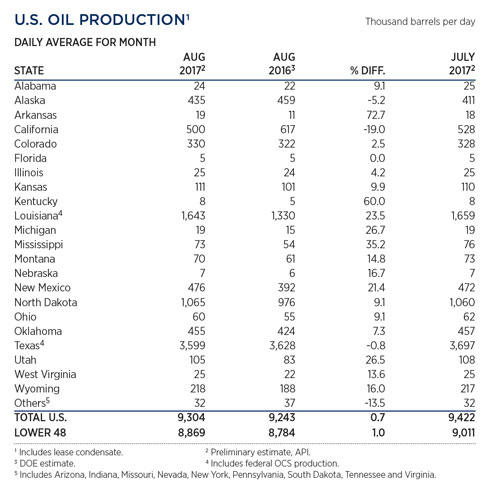
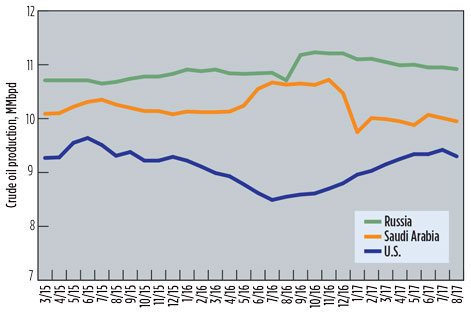
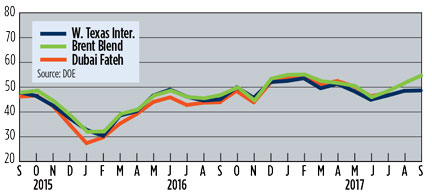
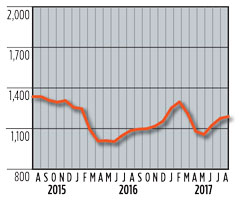
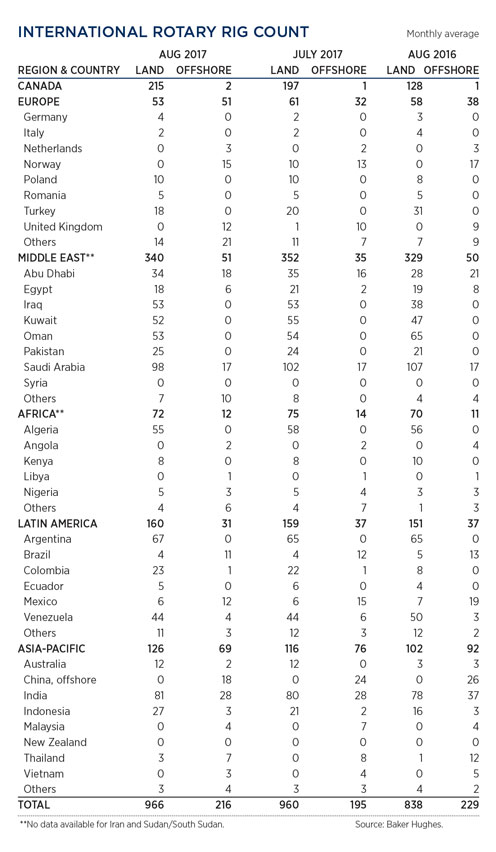
Crude prices continued to climb, as production cuts by OPEC and Russia finally started to make meaningful inventory reductions at major storage facilities in the U.S. and South Africa. Futures speculators are now willing to pay more to lock in future supply, referred to as backwardation, which signals the market has shifted back to a shortage pattern. In August, Russian output slipped to a yearly low of 10.91 MMbpd, due mainly to a shut-down for well maintenance in the Arctic. The U.S. produced 1.3% less crude compared to July, dropping to 9.3 MMbpd, with reductions in Texas and California totaling 126,000 bpd. With shale producers putting more emphasis on boosting profitability, the number of rigs working in the U.S. has flat-lined over the last three months, averaging 947 units. International activity increased by 27 units, averaging 1,182 in August.
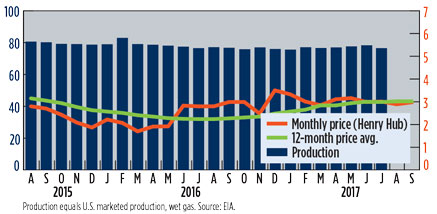
U.S. GAS PRICES ($/MCF) AND PRODUCTION (BCFD) GRAPH
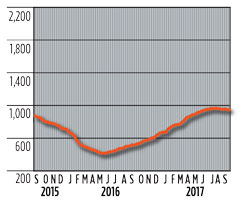
U.S. ROTARY DRILLING RIGS GRAPH
U.S. ROTARY DRILLING RIGS TABLE
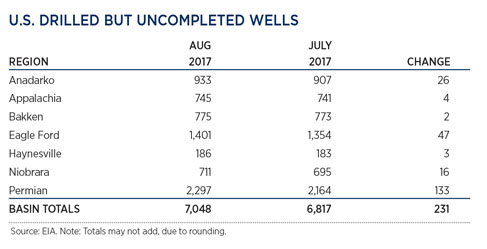
U.S. DRILLED BUT UNCOMPLETED WELLS
U.S. OIL PRODUCTION TABLE
WORLD CRUDE OIL PRODUCTION, TOP THREE PRODUCERS
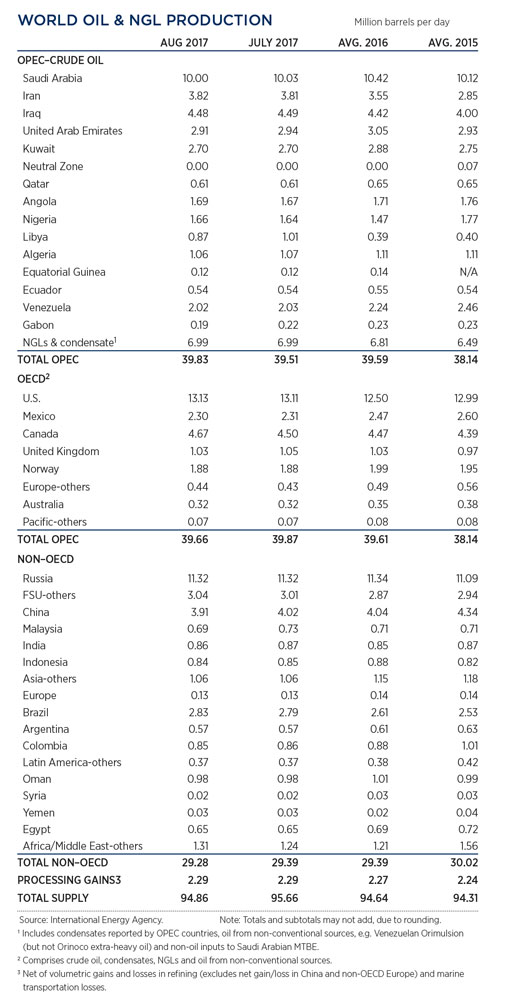
WORLD OIL PRODUCTION TABLE
SELECTED WORLD OIL PRICES GRAPH
INTERNATIONAL ROTARY RIG GRAPH
INTERNATIONAL ROTARY RIG TABLE
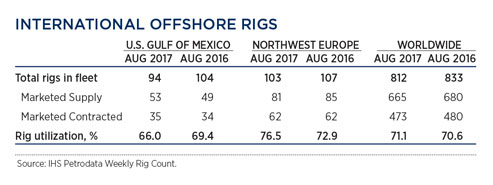
INTERNATIONAL OFFSHORE RIGS TABLE


