Industry at a Glance
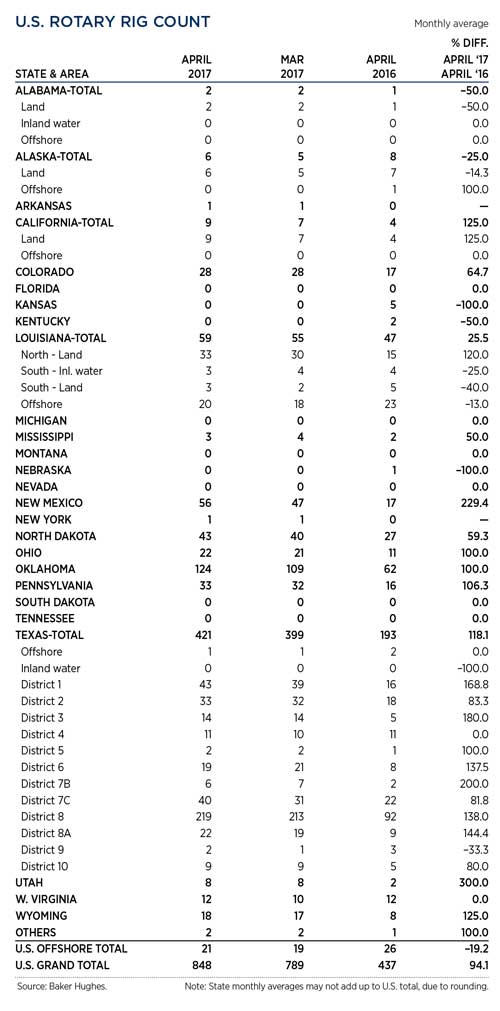
The tug-of-war between OPEC and Russia continued to play out, with each consortium struggling to retain its market share while reducing crude output sufficient to keep benchmarks in the $50/bbl range. With prices holding steady, U.S. drillers put more rigs back to work, pushing daily output up 1.4% in March, to 9.2 MMbopd. However, rising production in the U.S. postponed a meaningful drawdown of stockpiles, with 535.5 MMbbl of surplus inventory reported in March. Although talks intended to extend reductions continued in OPEC countries, financial/political issues in Russia will limit that country’s ability to participate in future actions. U.S. rig activity in April averaged 848 units, 94% more than the 437 reported during the same month last year. In March, the international rig count fell 78 units to 1,205, with the majority of the decline in Canada due to spring break-up. ![]()
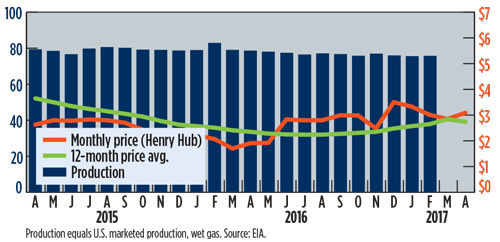
U.S. GAS PRICES ($/MCF) AND PRODUCTION (BCFD) GRAPH
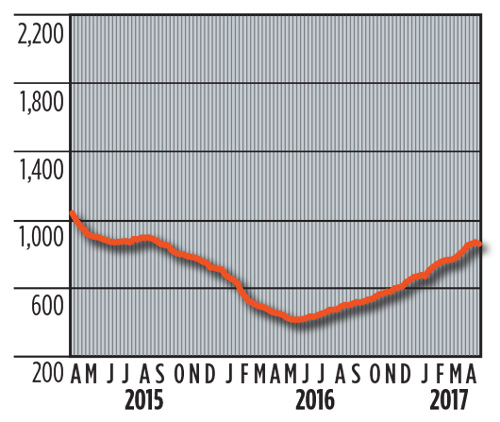
U.S. ROTARY DRILLING RIGS GRAPH
U.S. ROTARY DRILLING RIGS TABLE
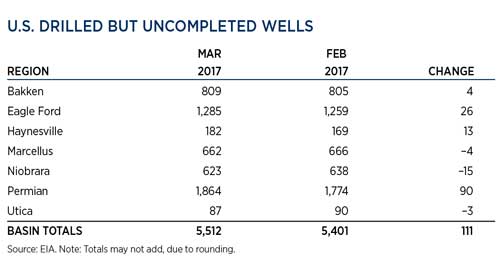
U.S. DRILLED BUT UNCOMPLETED WELLS
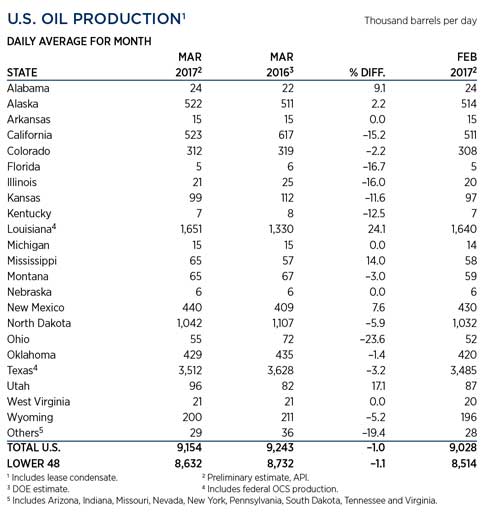
U.S. OIL PRODUCTION TABLE
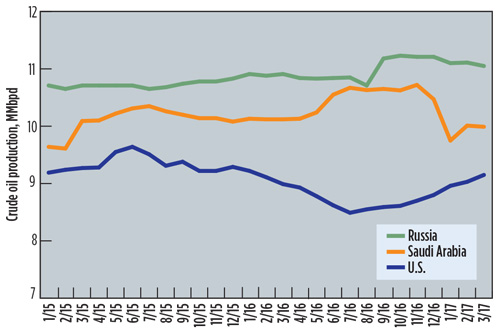
WORLD CRUDE OIL PRODUCTION, TOP THREE PRODUCERS
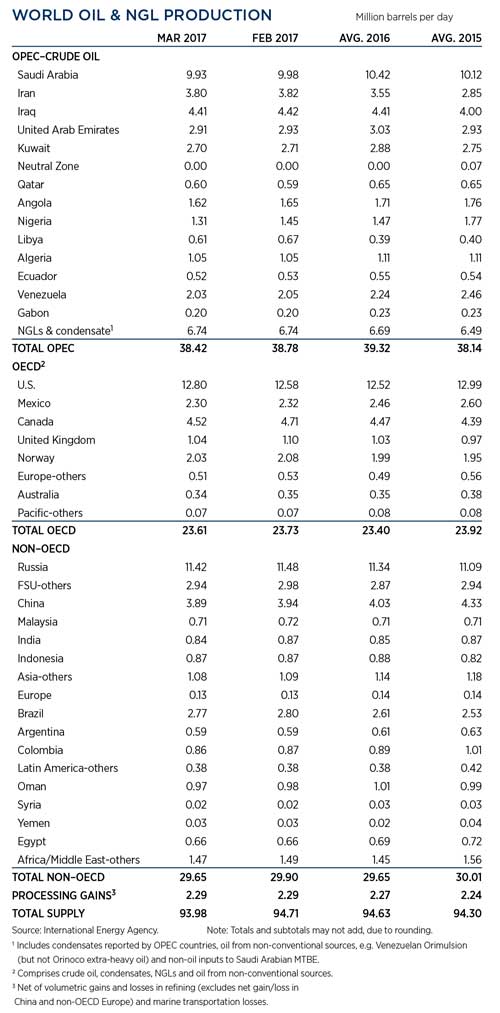
WORLD OIL PRODUCTION TABLE
SELECTED WORLD OIL PRICES GRAPH
INTERNATIONAL ROTARY RIG GRAPH
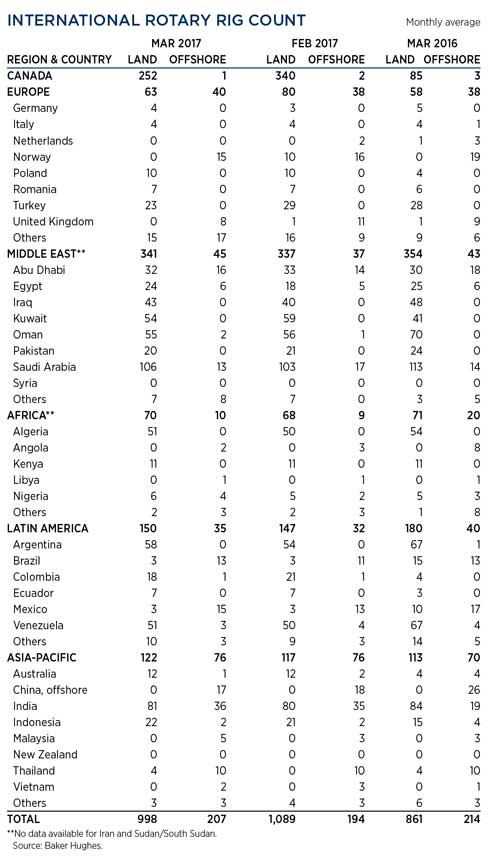
INTERNATIONAL ROTARY RIG TABLE
INTERNATIONAL OFFSHORE RIGS TABLE

- Applying ultra-deep LWD resistivity technology successfully in a SAGD operation (May 2019)
- Adoption of wireless intelligent completions advances (May 2019)
- Majors double down as takeaway crunch eases (April 2019)
- What’s new in well logging and formation evaluation (April 2019)
- Qualification of a 20,000-psi subsea BOP: A collaborative approach (February 2019)
- ConocoPhillips’ Greg Leveille sees rapid trajectory of technical advancement continuing (February 2019)

