Using innovative technologies to optimize completion operations in unconventional plays
Optimizing completion operations is a challenge faced by companies operating in unconventional plays. Since source rock has been targeted as the main hydrocarbon producing zone, the oil and gas industry has extensively invested in horizontal well technology, with hydraulic fracing becoming the main cost for production uplift. Determining an optimal landing depth for horizontal drilling, however, requires operators to define the location that produces the greatest hydrocarbon volume from hydraulic stimulations. Therefore, the successful development of organic-rich shale reservoirs depends on integrating the results of a wide range of disciplines, including the callibration of core and well log data, petrophysical and rock physics models, and finally, characterization of the key reservoir parameters (TOC, porosity and natural fractures) and mechanical properties from seismic data that constrain the ability of the rock to frac.
Geoscientists are continually looking for technologies that can help maximize valuable information from seismic data, and qualify the optimal location in shale formations, to improve operational parameters in order to better interact with the reservoir. Accurate earth models are needed to help identify and control potential hazards that may be encountered. These are achieved by integrating all geophysical, lithological, stratigraphic, petrophysical and geomechanical information derived from high-resolution seismic and well data interpretation.
This article describes two innovative technologies that lead to higher resolution in subsurface characterization: 1) Decomposition of the full wavefield into reflection and diffraction energy, as a complement to the established structural interpretation workflow; and 2) Rock type prediction interpreted at wells from seismic attributes (post- and pre-stack). The latter technique uses a probabilistic approach, based on a neural network association, to find patterns in seismic information in order to predict rock type.
These lead to an accurate, high-resolution and high-certainty model for improving risk-managed field development. We demonstrate the power of these technologies in both the Eagle Ford and Barnett unconventional shale plays.
MULTI-DIMENSIONAL SEISMIC DATA DECOMPOSITION
Diffracted energy of the recorded seismic data carries high-resolution information about small-scale discontinuities (faults, fractures, karsts, etc.). Accurate spatial identification of these small-scale features helps in the understanding of the hydrocarbon trap’s location and migration pathways, leading to optimized well placement. However, a conventional seismic reflection image does not carry this high-resolution heterogeneity information, as diffracted energy is normally suppressed by conventional pre-processing and standard imaging algorithms. Summations and averaging are applied by focusing on high specular amplitude in order to enhance the continuity of seismic reflection events. These conventional seismic reflection images may be able to map larger faults, but sub-seismic scale faults with very small displacement are often invisible on regular seismic volumes. In a traditional interpretation workflow, extracted information from such conventional seismic volumes may have a limited impact on small-scale displacement characterization.
Our approach is to separate the full wavefield into reflection (specular) and diffraction energy through a full wavefield decomposition, pre-stack depth migration that generates directional dip angle gathers. This type of gather organization serves as an ideal storage unit of the full wavefield, where different types of energy are being stored in different compartments (dips) without being mixed. Following the imaging process, various filters can be applied to the gathers to stack and enhance the different wavefields, providing interpreters with multiple energy stacks.
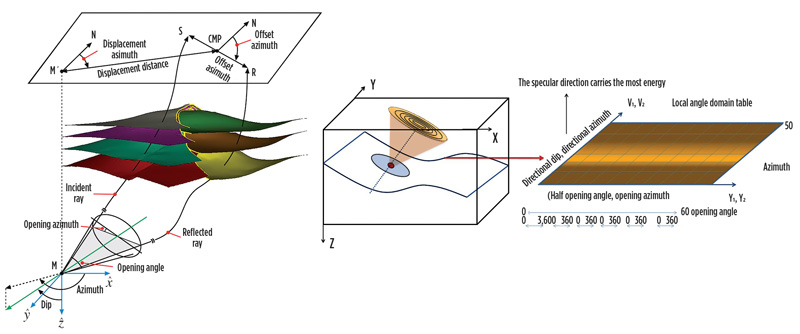
Method. Full-azimuth decomposition and imaging in the depth domain, also known as Local Angle Domain (LAD) migration, uses a series of bottom up ray tracings from subsurface image points to the surface. For each image point, a complete description of all directional dips and azimuths, as well as all opening angles and azimuths is stored in the 5D LAD, Fig. 1. Specular energy direction is the dip angle direction of the highest energy (amplitude), which coincides with the direction of the subsurface reflector. Other dip angle directions (other than specular) contain diffraction energy composed of either noise or small-scale discontinuity information.
Diffraction energy can be further enhanced by applying different energy weights or different dip angle filters. Because of this decomposition, we are able to create separate stacks to enhance the image of a particular object. This is done in the pre-stack domain after the migration. The detailed theory of the LAD decomposition/imaging technology is described in Koren and Ravve, 2011.2
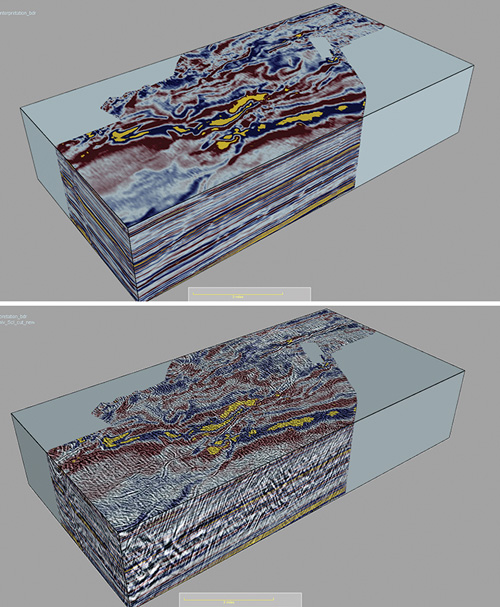
The resulting energy stacks (specular and diffraction) can be co-visualized in order to maximize the information obtained from the same recorded seismic data, Fig. 2. The diffraction volume also becomes one of the inputs for a high-resolution seismic interpretation workflow that can be associated with other structural attributes, such as coherence and curvature volumes.
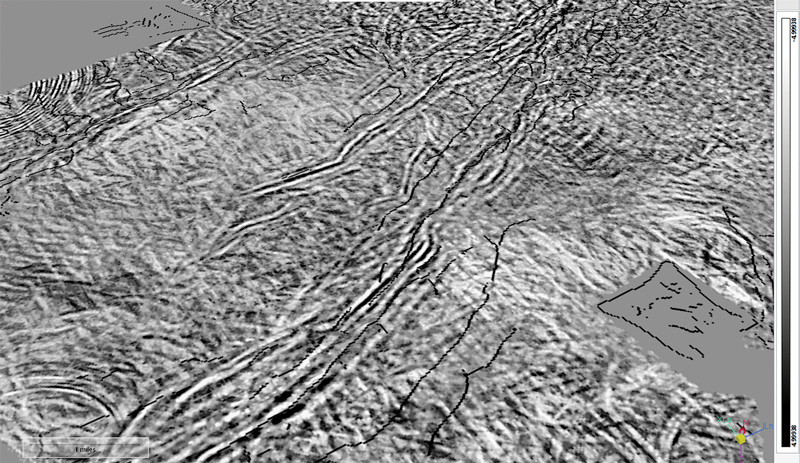
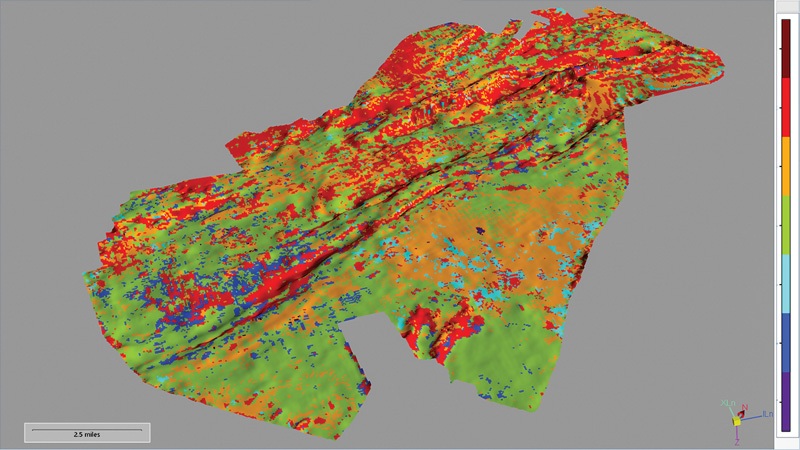
Figure 3 shows a diffraction-weighted energy stack (depth slice) co-visualized with a fault likelihood attribute. This combination enhances the differences between structural attributes created from a specular type attribute and the diffraction image. Diffraction images add more continuous information about finer-scale discontinuities to the existing structural interpretation.
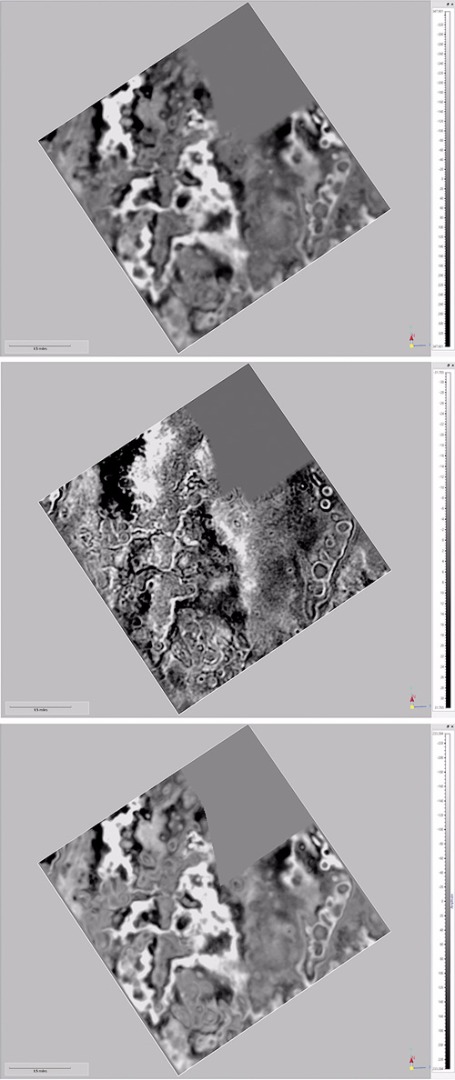
Another example may be seen in the Barnett shale formation, which overlies the aquifer limestone of the Ellenburger Group. High-resolution, detailed mapping and delineation of the karst system play a key role in the success of a well completion. A critical drilling success factor is the risk of connecting the Ellenburger formation through faults and karsts. Apart from the karst system, the structure of this area is quite flat, so the expectation is that reflection (specular) energy is mapped along the shallow dips. As such, a dip separation approach prior to stacking has the potential to enhance the image of structures with a certain dip, with a more detailed karst image being obtained by stacking dips between 15° and 30°, Fig. 4. Such details cannot be seen in conventional reflection seismic images.
INTEGRATING WELL AND SEISMIC DATA
In the early days of oil and gas exploration, geoscientists struggled from a lack of data, and subsurface knowledge was mostly experimental and intuitive. We now face the opposite problem, as advancements in seismic acquisition and geophysical processing have increased our knowledge from basic geology to a detailed understanding of subsurface phenomena.
The amount of available data, especially pre-stack, continues to increase exponentially. The challenge is how to make optimal use of this enormous amount of data, while assuring its reconciliation with other data types, such as well information acquired at different resolutions, using different tools and based on different theories.
Democratic Neural Network Association (DNNA) offers the possibility of reconciling 3D seismic data with well data. Following the recent development of 3D, 4D and 4C seismic imaging, we believe that a machine learning-based technology for automatic rock type estimation, using well facies groups and seismic data sets, can be of great help to the oil and gas industry. An automatic link between rock and seismic properties is made utilizing neural networks, and then used for reservoir rock type prediction. DNNA uses integrated well facies classifications and 3D seismic data (post-stack and/or pre-stack) as input.
Method. Geoscientists seeking to predict rock type using seismic attributes face three major challenges: 1) Well information is of higher resolution than seismic data; 2) Reservoir rock type is qualitative information; and 3) The relationship between rock type and seismic data will vary depending on the geological context, quality of seismic data, and available attributes.
In this context, the use of several neural networks in parallel (Tetko, 2002) appears to be the preferred method, as it can solve the problems mentioned above without any assumptions about the transfer function between seismic attributes and rock type defined facies (Hami-Eddine, et al., 2009).3, 1
The principle of DNNA is to take information from 3D seismic data jointly with rock type at the well. Hard training data extracted from wells is used to train a first set of neural networks. Soft data taken away from the wells is used to stabilize the neural network training. This combination of hard and soft data is used as a final set for training the final combination of neural networks. The training data set for the DNNA is constructed by selecting seismic data and facies (rock type) interpreted at wells. The xw is defined by a d-dimensional vector x and a weight w, being high for hard data and low for soft data. Hard data are considered highly reliable information and contribute a large weight to the neural networks training. Soft data provide information on the seismic data, but no information on the facies. They are used with low weights during the DNNA training. This weight qualifies the degree of reliability of training data. Each dimension corresponds to seismic data—such as angle gathers or specific seismic attributes, describing, at best, the properties of the reservoir—characterizing the sample.
Initially, training samples are built from seismic attribute values extracted along well trajectories, and a lithological facies index is used as a class indicator. A training sample is a pair( xw,c), where xw is the vector of attributes and c is the index of the lithological facies at a given well position. A training set is a collection of training samples.
Results. To overcome the fact that acoustic impedance may fail to detect the presence of hydrocarbons, the method of amplitude versus offset (AVO) inversion is used for Lambda-Mu-Rho attributes, to assess the physical behavior of the shale, as associated with incompressibility and rigidity. The Eagle Ford is the study area where this elastic parameter could be used for identifying prospective zones. Therefore, only post-stack seismic attributes derived from a seismic-driven reservoir characterization workflow have been integrated, together with spectral decomposition from the specular energy.
Rock type group determination was performed on existing wells, as the method requires having a full suite of logs available for facies determination purposes. This analysis was used to address the brittleness versus ductile behavior of the shale. A multi-resolution graph-based clustering (MRGC, Ye and Rabiller, 2000) was applied to a series of logs (acoustic impedance, shear impedance, Young’s modulus, Poisson ratio, Lambda-Rho and Mu-Rho) for the automatic determination of electrofacies.5 The study resulted in seven “reservoir rock types” that could be correlated to the mechanical behavior of the shale, based on their correlation with a brittleness index curve generated from a Poisson’s ratio and Young’s modulus.
A DNNA probabilistic model captures the detailed facies group description at the well location, building a consistent probabilistic model at the prospect scale from the seismic attributes. The training set is built from the rock type defined at the well, plus the extracted seismic trace along the wellbore for each seismic attribute considered in the project. Reconstruction rates are higher than 93% on all the wells used for DNNA training.
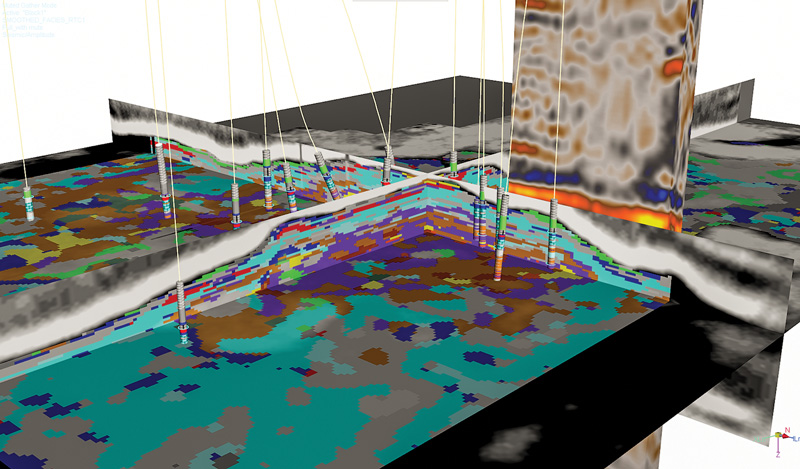
For all the wells, we observe a high correlation between the upscaled (to be “seen by the seismic”) and predicted facies logs as we obtain a high reconstruction rate (>93%) from the selected seismic attributes collection used to map the facies variations. Maximum probability is associated with the facies corresponding to the most brittle material. The model is then used to predict the facies distribution away from the wellbore, from the seismic attributes.The most probable facies distribution is summarized in a single volume, in which each value, at a given seismic grid location (x, y and z), corresponds to the most likely facies distribution from the prediction, i.e. each facies is associated with its highest probability value. The lateral distribution of the facies (Fig. 5) is consistent with the top and base structural interpretations, which define the Lower Eagle Ford. Figure 6 illustrates another example from complex carbohydrate reef tupe geologic environment, where this approach has successfully captured the vertical and lateral facies distribution heterogeneity of two layered reservoirs (carboniferous and Permian) from pre-stack data.
CONCLUSION
Diffraction energy, an important component of the full wavefield, is traditionally neglected, due to processing techniques and/or algorithms that are biased against this type of energy. This highlights the importance and benefits of diffraction imaging for high-resolution interpretation of some small-scale geological features. This technique is typically integrated with traditional interpretation workflows in order to improve fault interpretation, leading to higher accuracy in spatial fault identification and a better understanding of the structural framework. This is aimed at reducing uncertainty and drilling risk.
Determining the extension and internal description of reservoirs is highly challenging in an unconventional shale play. The use of all available data is crucial to extracting maximum information. It is equally crucial to capture the geoscientist’s input and understanding of the geology. The DNNA approach combines the ability to perform a multi-dimensional analysis of seismic data with the analysis of well-based facies interpretation. The prediction of facies “at large” distribution is an addition to techniques such as inversion for reservoir property estimation. Jointly using the facies observed at wells with seismic data adds a way to assess the reliability of the generated models for facies prediction. The neural network approach in this technique, used simultaneously with a Bayesian prediction method, provides a great opportunity to deal with well data and a large amount of pre-stack and/or post-stack data simultaneously, to determine lithology and rock type class. The probabilistic approach enables the building of multiple scenarios from best case to crash case, and helps to assess risk linked to uncertainties. ![]()
ACKNOWLEDGEMENTS
The author would like to thank Seitel for its permission to use the Eagle Ford seismic data and Paradigm for authorizing the publication.
REFERENCES
1. Hami-Eddine, K., P. Klein, L. Richard, B. de Ribet, M. Grout, “A new technique for lithology and fluid content prediction from prestack data: An application to a carbonate reservoir,” Interpretation, 2015, 19-32.
2. Koren, Z., and I. Ravve, “Full azimuth subsurface angle domain wavefield decomposition and imaging,” Parts 1 and 2, 2011, Geophysics, 76 (1-2).
3. Tetko, I. V., “Introduction to associative neural networks,” Journal of Chemical Information and Computer Sciences, 2002, 42, 717–728.
4. Tetko, I. V., “Associative neural network,” Neural Processing Letters, 2002, 16, 187–199.
4. Ye, S. J., and P. Rabiller, A new tool for electrofacies analysis: Multi-resolution graph-based clustering, Presented at 41st Annual Logging Symposium, 2000, SPWLA.
- Applying ultra-deep LWD resistivity technology successfully in a SAGD operation (May 2019)
- Adoption of wireless intelligent completions advances (May 2019)
- Majors double down as takeaway crunch eases (April 2019)
- What’s new in well logging and formation evaluation (April 2019)
- Qualification of a 20,000-psi subsea BOP: A collaborative approach (February 2019)
- ConocoPhillips’ Greg Leveille sees rapid trajectory of technical advancement continuing (February 2019)

