Natural gas markets: Review and forecast
Despite more competitive commodity prices, gas growth remains limited by the rapid expansion of renewable energy, advances in efficiencies and the economic downturn in some countries. Momentum in emerging markets, particularly in Asia, offset sluggish demand in the CIS, while demand rose slightly in OECD countries. Extreme cold weather in the last quarter of the year boosted world gas consumption significantly.
SUPPLY/DEMAND REVIEW
Following marginal growth in 2015, demand for gas in Asia-Oceania resumed its growth during 2016, driven by China and India. Following historically weak 3% growth in 2015, Chinese gas consumption rose in 2016 by an estimated 8%. This rate remains below the average for the past ten years (14% per year), but testifies to the initial positive impact of the de-carbonization policy initiated by the country. Additionally, 2016 was marked by a rebound in gas consumption in India, as regulatory reforms of domestic prices and the particularly low LNG spot prices helped to boost consumption.
After recording a 4% recovery in 2015, which was partly weather-driven, European actual gas consumption accelerated even further, by 6% in 2016. The demand recovery from the lows of 2011–2014 is a result of increased gas consumption in the power sector, plus signs of revival in industrial activity. The cold snap in Western Europe in the last quarter also contributed to the 2016 demand increase.
The growth rate of demand has slowed in North America (+0.3%). In the U.S., gas continued to gain ground on coal in the electricity sector, but mild temperatures weighed on household consumption during the first quarter.
In the CIS, gas consumption remained sluggish amid the economic slowdown, although cold weather boosted heating needs in the last quarter of the year.
On the supply side, the growth in global natural gas production came to a halt in 2016, following poor performances in North America, the CIS and Asian emerging markets.
During 2016, U.S. production posted a drop of 2.2% following ten years of strong growth; the weak rise in shale gas production could not fully offset the rapid decline in conventional output. Weak oil and gas prices led to a drastic decline in drilling and the closure of numerous unprofitable wells during the first three quarters. This was despite efforts undertaken by the industry to substantially reduce production costs.
Gas production declined slightly in the CIS, the region with the second-highest production worldwide. Russian production increased slowly by 0.8%, while output in Turkmenistan and Uzbekistan fell sharply.
In the Middle East, production was stimulated by the growth of major non-associated gas projects in Iran, Saudi Arabia and the United Arab Emirates.
Gas production in Asia-Oceania was boosted by successive start-ups of LNG projects in Australia, while production remained lackluster in many emerging markets. Chinese production growth remained weak (+2% per year), reflecting a slowdown in exploration and development activity amid low oil and gas prices, as well as competition from imported gas and LNG.
European output was still impacted down by the production cap at the Groningen deposit in the Netherlands, which has been revised downward successively. In 2016, natural gas production in the Netherlands is expected to have decreased 7%, to historic lows.
Following a sharp increase in 2015, Norwegian production slipped 0.5% to 116.7 Bcm in 2016, amid extensive maintenance work throughout the year. According to official estimates, Norway’s gas output is expected to stay flat through 2021, illustrating a stable, high level of gas sales from the Norwegian shelf in the short term. Marketed gas production in the United Kingdom rose 3.5%, to 38 Bcm. This is due, in part, to higher volumes of gas following the opening of the relatively large Laggan field in the middle of 2016.
Natural gas production in Africa and Latin America remained relatively stable and witnessed very contrasted developments between countries.
In 2016, international gas trade (net of LNG re-exports) showed a significant acceleration, up 6% to 1,099 Bcm. International trade was propelled by both pipeline trade (+5.6%) and LNG flows (+6.7%). The strong growth in pipeline trade resulted mainly from increased European natural gas needs, while indigenous production declined.
In 2016, the industry also saw a significant acceleration in international LNG supply, on the back of the start-up of new projects in Australia, and to a lesser extent, in the U.S. Emerging markets of Asia, the Middle East and North Africa (Egypt) were the main recipients for the incremental LNG, offsetting a decline in imports by Japan and Latin America.
These developments led to lower-than-expected LNG imports in Europe. Floating storage and regasification units, or FSRUs, were favored, since they reduce costs and shorten construction schedules. Three countries—Pakistan, Egypt and Jordan—entered the LNG market in 2015 by using FSRUs, and should account for substantial additional demand of more than 11 Bcm in 2016.
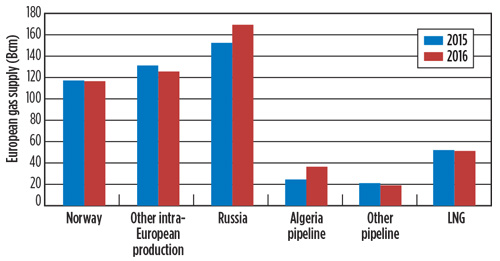
Thus, in Europe, including OECD Europe and Central Europe, pipeline supply extended dominance over LNG, Fig. 1. Net gas imports via pipelines rose more than 13% in 2016, with boosts recorded from both Russia and North Africa. European gas imports by pipelines from Russia and Algeria surged by 11% and 49%, respectively, to reach multi-year highs in 2016. These trends took place in the context of a bearish oil price environment that favored oil-indexed gas price competitiveness.
Moreover, Norwegian gas supplies, despite hitting a record annual high in 2016, recorded a marginal increase over 2015. The dependence of Europe on extra-regional sources continued to rise from 50% in 2015 to 53% in 2016. Gazprom’s market share increased once again, to 33% in 2016. LNG imports contributed 10% to the European natural gas supply, compared with 15% in 2010.
PRICING FUNDAMENTALS
Weak gas market fundamentals, an LNG supply ramp-up and low oil prices led to a reduction in international gas prices, and convergence among regional benchmarks. In Europe, the average price of gas and spot prices reached near identical levels. The share of spot price indexation in the Western European gas supply continued to gain in significance, reaching approximately 70% today.
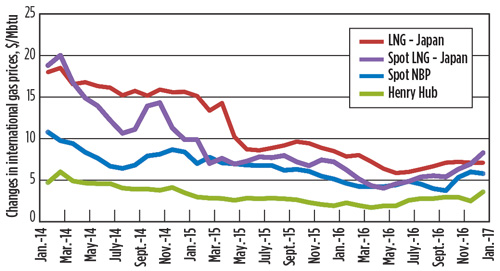
CEDIGAZ estimates point to an average price (estimated with indexation to the 70% NBP spot price) of $4.8/MMbtu in 2016, compared with $6.8/MMbtu in 2015. The NBP spot price fell around $4.7/MMbtu in 2016, compared with $6.5/MMbtu in 2015, reaching its lowest annual level since 2009.
In 2016, the average price of LNG in Japan, almost entirely indexed to the price of oil, is estimated at $6.9/MMbtu, compared with $10.2/MMbtu in 2015. Maintenance shutdowns and delays in Australian projects also caused a slight tension on prices. At the end of the year, spot prices had jumped to over $8/MMbtu, due to tensions in LNG supply, as well as nuclear power outages in northeast Asia and cold weather.
In 2016, the average Japanese spot price was estimated at $5.6/MMbtu ($7.6. MMbtu in 2015). In the U.S., resilient production combined with weak demand and high inventory levels helped keep the annual average Henry Hub price at a relatively low level of $2.5/MMbtu, Fig. 2.
SHORT/MEDIUM-TERM TRENDS
Tensions in Asian and European spot prices at the end of 2016 should not reoccur in the short term, since excess LNG supply on the international market is expected to increase in 2017 and 2018. Moreover, Russia has broad, excess production capacity, and 2016 suggests that Gazprom will favor a policy to consolidate its market share by keeping export prices low. Against this background, oil-indexed prices will likely climb to levels greater than spot prices.
Demand forecast. The numerous major changes that have punctuated the gas industry in recent years suggest moderate increases in short- and medium-term demand for natural gas. The growth for gas demand worldwide over the next five years should remain slower than that recorded during the past decade for the following reasons:
- The trend toward massive deployment of renewable energies, which are competitive with, and complementary to, gas.
- The rapid decline in energy intensity (relationship between energy consumption and GDP), which penalizes all fossil fuels.
- Continued competition between gas and coal. Environmental regulations will be decisive in the growth of gas demand.
According to CEDIGAZ, continued growth of about 1% to 1.5% per year is expected toward 2021–2022. Given the expected weak growth in global energy demand, gas should, nevertheless, gradually increase its share of the energy mix.
In OECD countries, natural gas growth will remain limited, due to market maturity, weak demand for electricity and competition from other energy sources.
Conversely, in some emerging markets, such as China, India and the Middle East, energy, environmental and regulatory policies designed to increase the share of gas within the energy mix should bear fruit. In addition, low LNG prices may promote gas consumption in certain countries, where demand is highly price-elastic. This is specifically the case in China and India. ![]()

