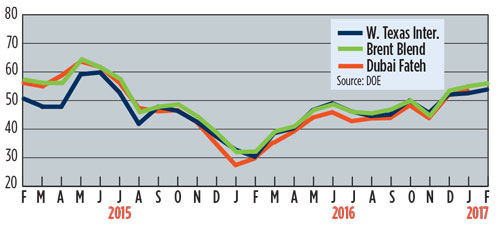
Industry at a glance
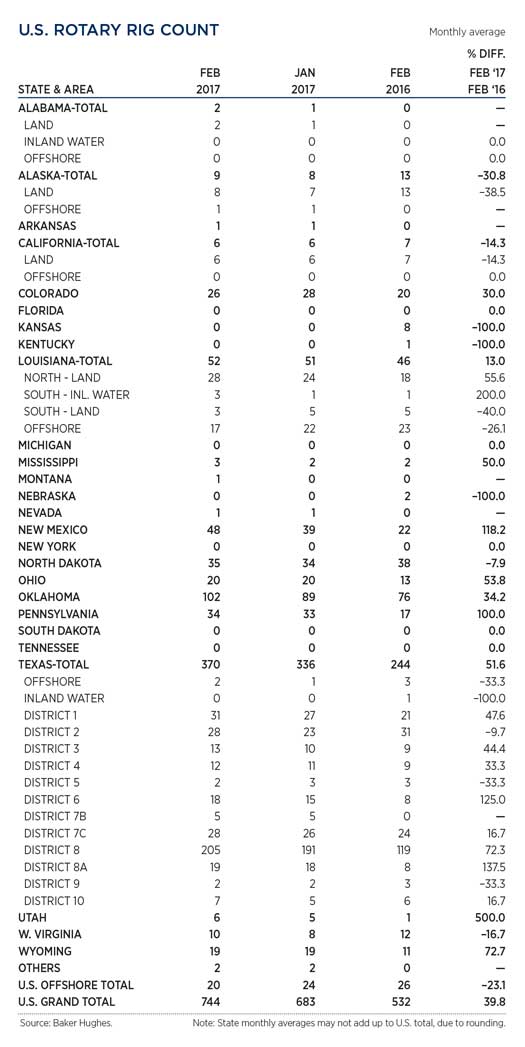
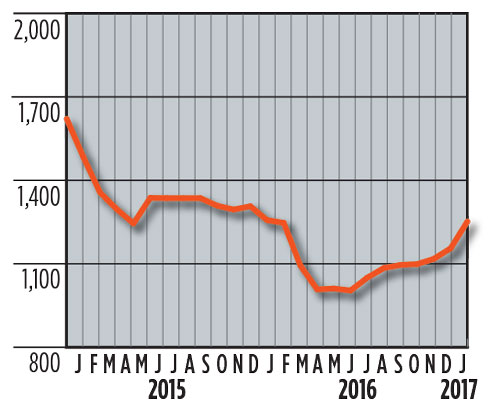
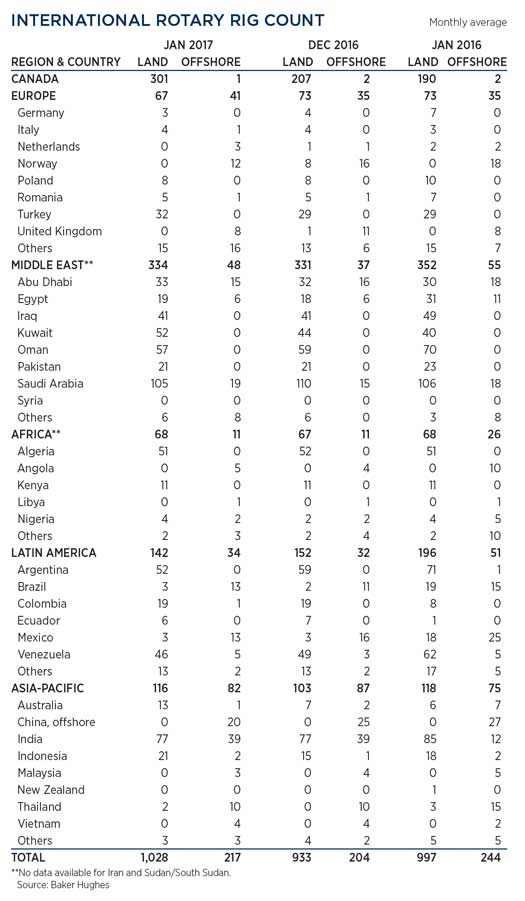
OPEC’s production cut put a floor under crude prices, as benchmarks averaged $54.60/bbl in February, but the prolonged stability has awakened U.S. shale plays. This, combined with a 55% decrease in break-even prices (since 2013) in key unconventional U.S. basins, has caused E&P companies to add 110 rigs this year, as of Feb. 26. Since September, U.S. production has been rising at an average rate of 93,000 bpd, and crude stockpiles hit 518.6 MMbbl during the week ending Feb. 15. These factors threaten OPEC’s price support strategy and will put downward pressure on commodity prices, when the agreement ends June 30. In February, the average U.S. rig count surged 8.9%, hitting 744 units, 61 more than counted in January. The international count gained 108 rigs in January, an increase of 9.5%, to average 1,245 units.
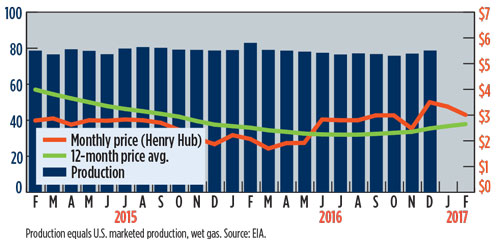
U.S. GAS PRICES ($/MCF) AND PRODUCTION (BCFD) GRAPH
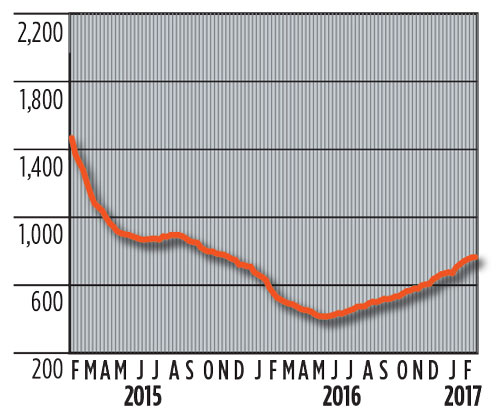
U.S. ROTARY DRILLING RIGS GRAPH
U.S. ROTARY DRILLING RIGS TABLE
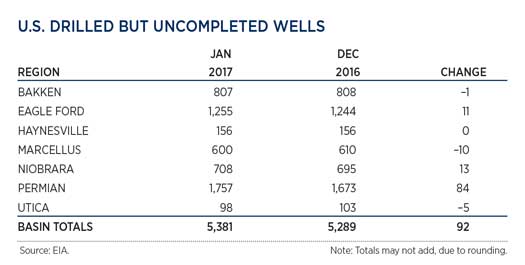
U.S. DRILLED BUT UNCOMPLETED WELLS
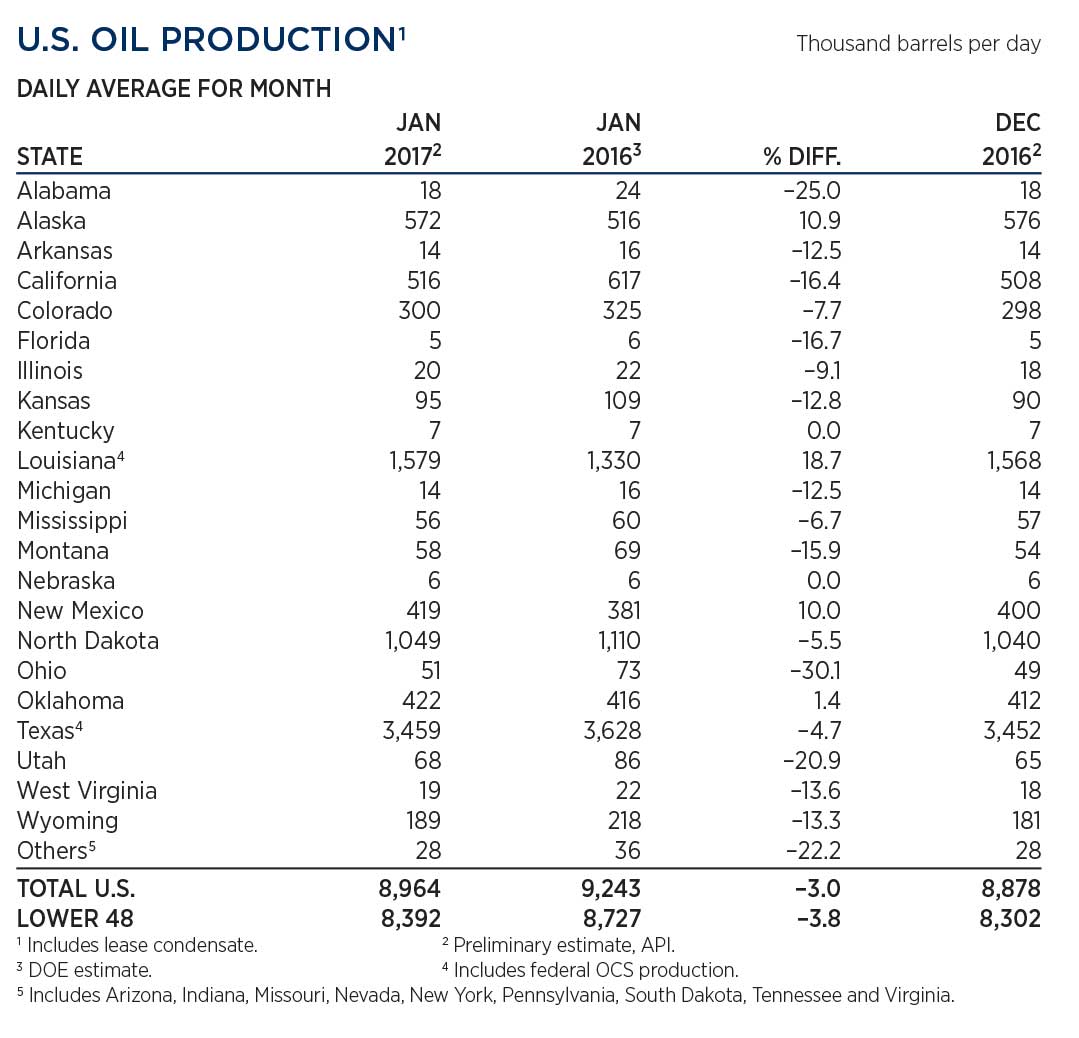
U.S. OIL PRODUCTION TABLE
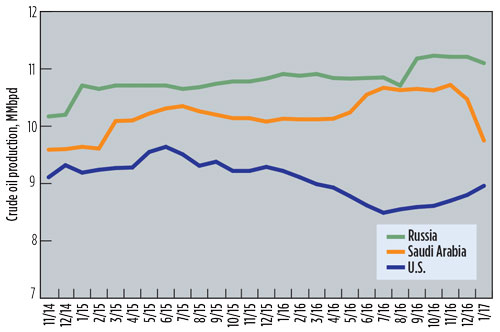
WORLD CRUDE OIL PRODUCTION, TOP THREE PRODUCERS
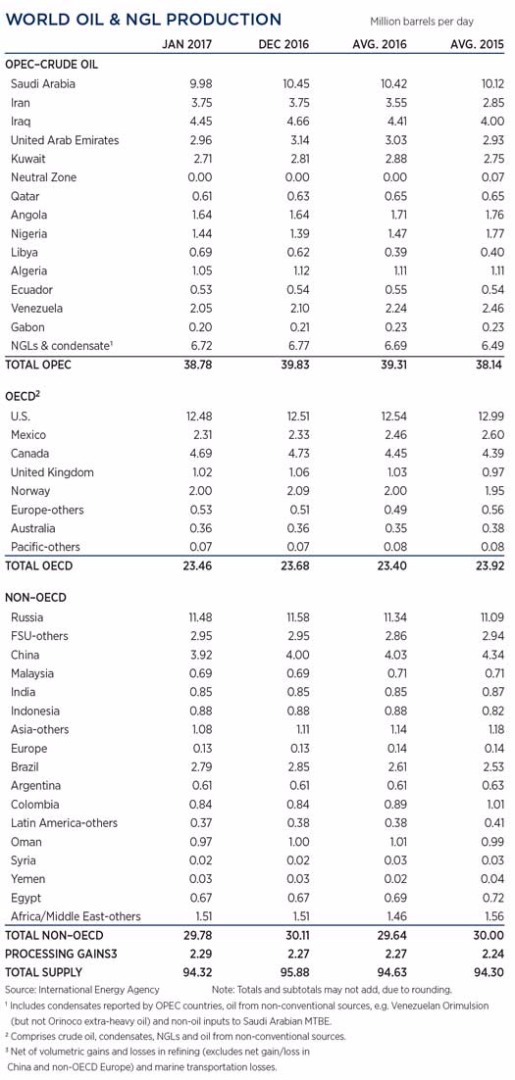
WORLD OIL PRODUCTION TABLE
SELECTED WORLD OIL PRICES GRAPH
INTERNATIONAL ROTARY RIG GRAPH
INTERNATIONAL ROTARY RIG TABLE
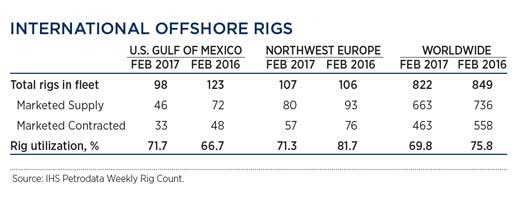
INTERNATIONAL OFFSHORE RIGS TABLE


