What’s new in well logging and formation evaluation
The price of oil appears ready to rebound in 2017, and companies are beginning to look into hiring, after the industry shed roughly 440,000 jobs through the end of 2016.1 There have been a number of valuable texts have been published in the past few years on logging,2,3,4 petrophysics, core analysis,5,6,7,8 and formation evaluation of unconventional reservoirs.9 Also, major review papers on pore-scale imaging techniques,10,11 and discussing the variety of brittleness indexes used in shale completion modeling,12 were also published.
LOGGING WHILE DRILLING
Wellbore position. Primer on Wellbore Positioning is an ebook published by the University of the Highlands & Islands (UK). It is freely available on their website.13
Ranging system. Halliburton introduced a new magnetic-ranging well-positioning method that does not require access to the target wellbore for the surface excitation. Instead, the surface excitation is connected to the wellhead of the target well, and it transmits a current signal along the cased-hole target well. The array gradiometer in the nearby drilling well receives the corresponding magnetic fields, and calculates the relative distance and direction between the two wells. This system, which was designed primarily for SAGD applications, eliminates the need for a wireline ranging tool deployment in the target well. It also has application in wellbore intersection and well positioning applications. Compared to existing systems, this one improves equipment logistics and eliminates the wireline ranging tool deployment, while reducing the cost and risk to the operator and the number of personnel needed to deliver the service.14
Continuous surveying. Researchers at the University of Calgary have proposed a low-cost strapdown inertial system (SINS), using three orthogonal MEMS accelerometers and three orthogonal MEMS gyroscopes to provide survey data along an entire well trajectory, without interrupting drilling. Conventional magnetometer- and gyroscope-based systems provide survey data at stationary surveying stations (30-m intervals). This type of system could eliminate the need for non-magnetic collars, and the small size of the MEMS sensors would allow its use in small-diameter wellbores.15 In a separate development, an advanced processing technique uses continuous D&I measurements to provide wellbore survey data at 3-m intervals.16
Survey accuracy. Several new models have been proposed for improving survey accuracy. The Colorado School of Mines, 3D advanced spline-curve model calculates the well trajectory, using continuous derivatives up to the third order, along the entire well path. The improved model allows more accurate wellbore positioning, more realistic estimates of borehole tortuosity, and a measurement of borehole rugosity.17
Initiating downhole directional surveys. Conventional directional survey devices use recycling of the mud pumps during pipe connections to trigger the directional survey and send the data to surface. Another method, described by Schlumberger, uses cessation of pipe rotation, rather than cessation of the mud pumps, to trigger a survey. Surveys taken using this approach can be made prior to the pipe connection. Following the connection, the drillstring does not have to remain stationary. This approach eliminates the need to recycle to pumps to take surveys, and enables surveying with a full, unchanged flowrate (constant BHP), which minimizes surge and swab effects, thereby reducing risks of borehole instability and stuck pipe. The surveying method reduces overall surveying time and has benefits in MPD, UBD, and air drilling.18
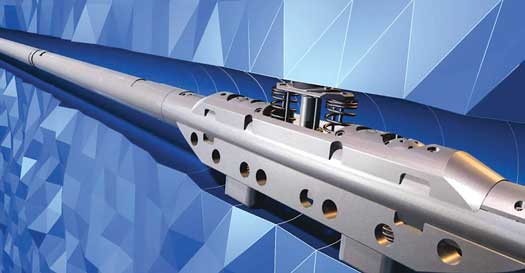
Dual-telemetry MWD. NOV Wellbore Technologies introduced a retrievable dual-telemetry MWD tool (BlackStar II) that combines the capabilities of electromagnetic (EM) and mud-pulse (MP) data transmission, Fig 1. With the BlackStar II retrievable MWD, switching from EM to MP transmission can be performed via EM or RPM downlinking to avoid costly trips to change out equipment. The modular design allows flexibility in configuring the toolstring to maximize operational capabilities. By incorporating a special translation module, a standard off-the-shelf mud pulser can be run with this system without modifications. The new system offers a full suite of MWD sensors, including directional, gamma, internal and annular pressure, axial and radial vibration, ROM and temperature.19
High-temperature systems. Halliburton introduced a high-temperature MWD/LWD service (Quasar Pulse/QuasarTrio) that offers full triple-combo logging capability in hostile environments up to 392°F, and pressures to 25,000 psi. The basic MWD service delivers directional, gamma ray, pressure-while-drilling and vibration data for precise wellbore placement in HTHP zones. The LWD service delivers resistivity, density, and neutron porosity. The resistivity tool has three T-R spacings, and provides 12 resistivity measurements over a range of investigation depths. The density tool uses a conventional Ce-137 source and dual detectors, and has improved stabilization electronics and software to provide a stable measurement over the full temperature operating range. The neutron-porosity tool is a conventional configuration, with an americium-beryllium nuclear source and a pair of He-3 detector banks. The service is available in 4¾-in. and 6¾-in. for boreholes up to 97/8-in.20
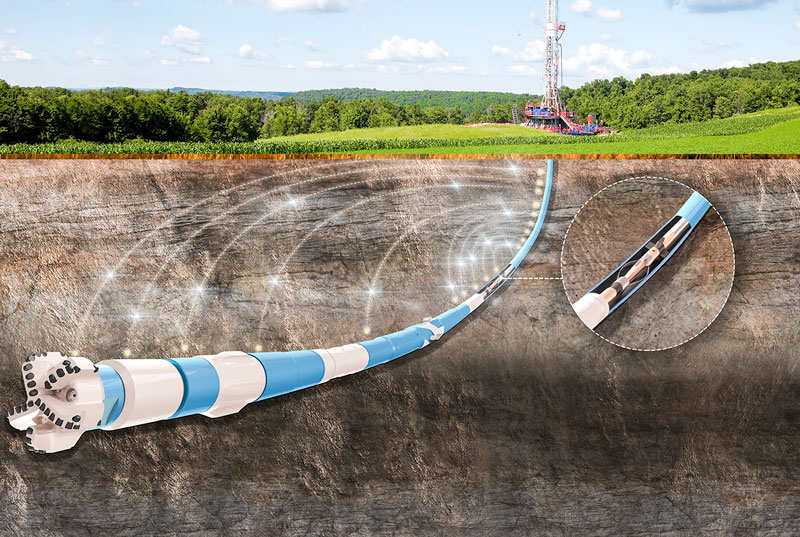
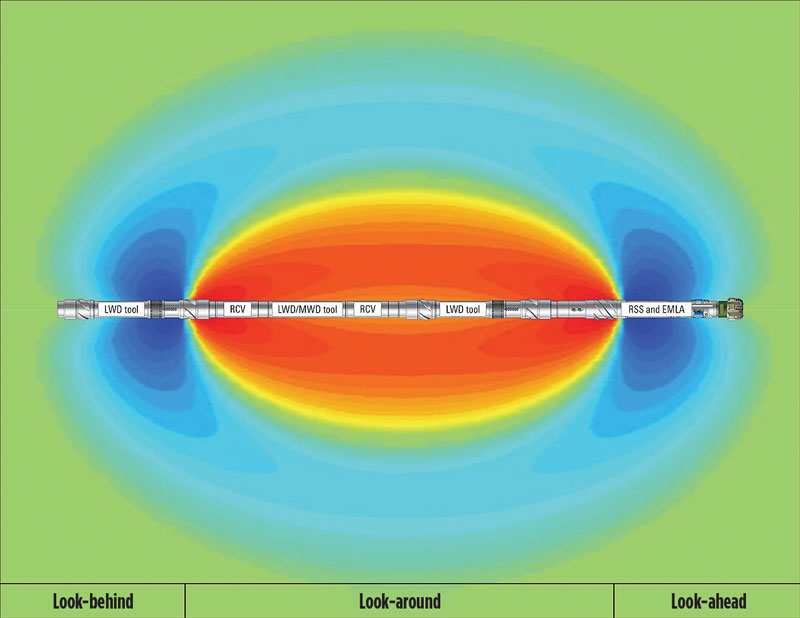
EM logging. Schlumberger introduced prototypes of its new electromagnetic look-ahead (EMLA) tool, Fig. 2. It uses the same sensor technology, and operates with the same multispacing and multifrequency measurements, as the commercial ultradeep “look-around” directional resistivity tool used in the mapping-while-drilling service (GeoSphere). EMLA is modular and consists of a low-frequency transmitter inserted in the RSS, 1.8 m behind the bit. It has 2–3 triaxial receivers in the drillstring, offering a flexible configuration for different applications. This configuration can detect changes in resistivity, tens of meters ahead of the bit, at all incidence angles in vertical and low-angle wells. A compensated resistivity measurement is made 3 m from the bit, to provide a shallow resistivity measurement used in the interpretation inversion. Look-ahead capability can reduce drilling risk by allowing proactive geo-stopping, to establish casing points above a drilling hazard, or to optimize coring points in a target reservoir. Prototypes have been designed for 12½-in. to 14-in. boreholes. The tool’s primary application, to date, has been to drill the well section above the reservoir, closer to the top of the reservoir to avoid complications in the shale above the reservoir.21
Acoustic logging. Knowledge of shale anisotropy is critical for optimizing completion design. However, measuring shale acoustic anisotropy in horizontal wells, using wireline dipole tools, can be difficult, due to conveyance problems and inaccuracies in the required dispersion corrections. By contrast, a unipole tool configuration is more efficient at measuring azimuthal shear anisotropy in fast formations, because the transmitters and receivers are oriented in the same direction, and directly measure refracted head waves from the component compressional and shear measurements; no dispersion correction or inversion is required.
Schlumberger’s oriented, unipole sonic measurement service (SonicPacer) has a symmetric array of two transmitters and four receivers, with a T-R spacing of 4 ft and an inter-receiver spacing of 1 ft; an array of tungsten slugs between each transmitter and receiver attenuates the tool collar-mode signal. The tool has a high-resolution, focused, pulse-echo transducer to generate ultrasonic standoff and amplitude measurements that can be used to make a high-resolution image of the borehole, Fig. 3.
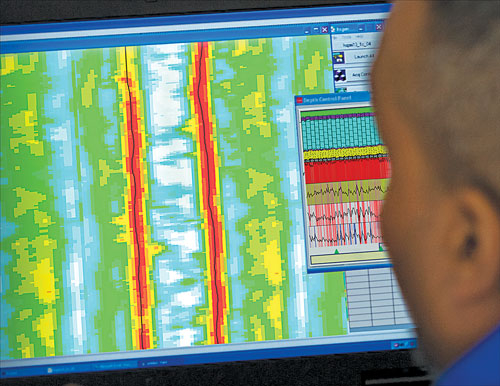
Compressional and shear slowness results can be calculated downhole and sent uphole in real-time for rapid decisions. The raw sonic waveforms are stored in memory and can be processed, on surface, to produce an anisotropic stress profile to optimize fracturing operations. The tool is available in 4¾-in. and 6¾-in. collar sizes. Applications include: 1) completion optimization for unconventional reservoirs; and 2) assessment of horizontal well placement, using sonic images of geologic structures, borehole shape, and fracture identification and characterization.22
Large-hole tools. Halliburton introduced a 9¼-in. version of its lithodensity tool (Azimuthal Lithodensity) for use in boreholes with up to a 17½-in. diameter. The larger tool provides the same functionality as its smaller counterparts, including azimuthal density and photoelectric and acoustic standoff measurements.23
Schlumberger introduced an 8¼-in. version of its LWD NMR tool (proVision Plus) for use in boreholes between 10¼-in. and 12 5/8-in. The larger tool has a 17-in. diameter of investigation and can accommodate mud flowrates up to 1,200 gal/min.24
Borehole imaging. In complex lateral and reservoir sections, the use of invert emulsion OBM is preferred over WBM, due to the higher performance provided by OBM and its ability to reduce operational risks. Although wireline resistivity imaging devices have been developed for specific use in OBM, LWD resistivity imaging tools are designed for use in conductive mud systems. Baker Hughes is testing an electrically conductive OBM system that supports the deployment of low-frequency, high-definition LWD resistivity imaging tools. The invert emulsion drilling fluid allows real-time, high-resolution resistivity imaging without sacrificing the performance of an OBM.25
Sampling-while-drilling. When sampling-while-drilling, it is essential that downhole estimates of fluid properties and fluid contamination are reliable, as these may be the only available estimates of clean-fluid properties in zones where fluid scanning was performed with no physical sample recovery. The contamination estimates, together with the real-time fluid property estimates, enable prediction of the uncontaminated fluid properties. Schlumberger compared downhole “field” estimates of fluid properties from sampling-while-drilling operations with laboratory PVT analyses made on the recovered samples and found good agreement, as did comparison of downhole-predicted clean-fluid properties with laboratory-cleaned estimates.26
In another development, Baker Hughes developed an advanced fluid-typing algorithm to simplify the interpretation of the cleanup process during sampling-while-drilling operations. The algorithm incorporates interpretation guidelines from field applications and includes information about the mud type from measurements of refractive index, compressibility, density, and sound speed. An independent analysis of the sensor data is performed for each fluid component, and the sensor readings are weighted, using the reliability and accuracy of the measurement system. Real-time display enables easier identification of the fluid type pumped and simplifies decision-making during the pump-out process.27
OPENHOLE WIRELINE LOGGING
Tractor Conveyance. Tractors provide an efficient alternative to LWD and drillpipe conveyance of logging tools in highly deviated and horizontal wells. Schlumberger’s all-terrain wireline tractor (UltraTRAC) is a 3 3/8-in. wheel-driven device, with active traction control and bidirectional capabilities. It can run on hepta- or monoconductor cable. Its modular design can be configured with 2 to 8 drives, with each unit providing up to 400 lbf of pulling force. Different size/design wheels are optimized for a range of well geometries and conditions. Extended-reach arms are capable of opening to 15 in., allowing the tool to adapt to variations in borehole geometry and washouts. A tandem sub enables independent surface control of the drives above and below the sub. This control helps operators navigate borehole restrictions and washouts.28
Acoustic logging: near-well imaging. Baker Hughes has extended the method of dipole shear-wave reflection imaging (DSWI)29 to imaging complex, near-well structural features and bed boundaries in slow formations surrounding salt-related features. Deep compressional-wave imaging is a new method of acoustic acquisition, processing and 3D visualization that uses low-frequency compressional body waves generated by a dipole source to increase the depth of investigation, thereby allowing imaging of fractures and structural features up to 100 ft away from the borehole with reduced attenuation effects. Integrating the new technology with resistivity logs, borehole imaging, and VSP, can improve the level of detail of structures surrounding the borehole.30
Borehole imaging. Exxon Mobil presented a new automatic dip-detection method to identify formation dip in horizontal and high-angle borehole images acquired by any dipmeter and pad-type image tool. It consists of three main steps: 1) determining an optimal sinusoidal trend on the image at each depth using a minimum-variance technique; 2) computing the contrast at each depth along the optimal sinusoidal line on the gradient image; and 3) locating bedding surface boundaries at depths with the highest contrasts. This method has substantially reduced interpretation time (up to 80%) and dip uncertainty in building earth models from image logs for logging tool-response modeling in petrophysical evaluation.31
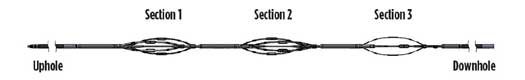
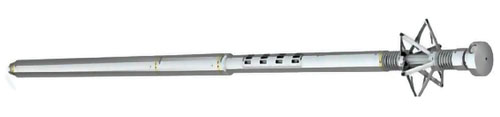
Small-diameter fullbore micro-imaging tool. Schlumberger introduced a slim, full-coverage through-the-bit imaging tool, designed to acquire high-resolution images in lateral wells in unconventional reservoirs. The 2 1/8-in. tool comprises three measurement sections, each having four pads on bowspring centralizer arms that provide two independent calipers, Fig. 4. Each pad has two rows of six electrical buttons, totaling 12 measurement buttons, for a total of 48 buttons per section, 144 total. Tool resolution is 0.2 in., and borehole coverage is 76% in 6-in. holes, and 57% in 8-in. holes. The tool provides six caliper measurements, and has a triaxial accelerometer to provide to acceleration and relative bearing, and is fully combinable with all other through-the-bit measurements.32
Nuclear logging. Weatherford introduced a new small-diameter, spectral gamma-ray tool as part of its line of compact logging devices. The 2¼-in. tool can be deployed on wireline, or without wireline, in memory mode using a drillpipe shuttle.33
Gamma-ray calibration. An effort is underway to establish a worldwide network of gamma-ray calibration facilities by using tools that have been calibrated at different facilities. Preliminary investigations show it is possible to reconstruct the KUTh grades at facilities in Grand Junction, Colo. and in Adelaide, Australia, using calibration data taken at a completely different setup in the Stonehenge R&D site in The Netherlands.34
Wireline formation testing. Shell’s formation-testing group authored several valuable best practices review papers. They cover the current state and future trends in downhole fluid analysis for reservoir evaluation, on methods for obtaining improved permeability estimates from WFT pressure transient data, and how to obtain representative water samples using WFT.35,36,37
Pressure tester. Baker Hughes introduced an advanced wireline formation pressure testing service (FTeX). The 3 7/8-in. single-probe tool can operate in borehole sizes ranging from 4¾-in. to 16 in. and is rated to 350°F and 30,000 psi, Fig 5. The service automates the operational sequence downhole to optimize tool controls and test parameters with minimal input from surface personnel, thereby reducing data inconsistencies and inaccuracies. The closed-loop system analyzes the pressure 100 times/sec, making micro-adjustments to the flowrate to optimize the pressure drop, while making sure to remove enough fluid. This allows the flowrate to go as low as 0.001 cm3/sec. Real-time control is used to eliminate supercharging. The formation response from the first drawdown is used to define a behavior for subsequent drawdowns in real time—this allows the service to determine optimal pressure measurements, leading to increased data accuracy and data acquisition in half the time required by similar tools.38
Slim-profile formation sampler. Weatherford’s compact formation sampler (MFTD) can acquire up to three 700-cm3 formation-fluid samples for PVT analysis, in borehole sizes ranging from under 3 in. to 14 in. The 2.4-in. diameter tool employs a self-centering design to reduce the risk of sticking, and it enables deployment on wireline or through drill pipe. Realtime and recorded pressure data acquired by the sampler can be used to calculate formation-pressure gradients, ascertain fluid-contact levels, determine fluid mobility, and define formation permeability.39
CASEDHOLE WIRELINE LOGGING
Well integrity. In contrast to conventional, acoustic-based cement-evaluation methods, Halliburton has proposed a gamma-gamma technique that employs a tool with a Ce-137 source and a sodium iodide scintillation detector that is designed to be sensitive only to the cement in the annular space behind the inner casing. The detector response varies with different degrees of cement integrity. The count-rate ratio, and the dipping point values from the gamma-ray spectrum, are used to determine the amount of void space and its position inside the cement, which can be used to image channels inside the cement.40,41
Heavy mud and thick casing. Two service companies recently described advances in ultrasonic logging systems that now allow cement and casing evaluation in wells with heavy mud and/or thick casing. New, specially designed transducers are central to both.
Schlumberger has field-tested a new high-powered/sensitivity transducer that employs both the pulse-echo and flexural-attenuation techniques. Using a transducer optimized for thick casing, the operating limit of the pulse-echo measurement was pushed beyond a 1-in. thickness; using a high-sensitivity thin-casing transducer, cement and corrosion evaluation is now possible in muds exceeding 16.7 lbm/gal. The new transducers are rated for temperatures up to 350°F and pressures of 20,000 psi. The tool and associated processing software provide images of casing condition (shape, thickness and corrosion state), cement acoustic impedance and cement-induced flexural attenuation in a single run. In many instances, the cement-to-formation or cement-to-outer casing can be imaged as well, enabling determination of the casing position in the borehole, the cement sheath geometry and the sound velocities of the annulus.42,43
Halliburton has tested a new pulse-echo tool (Fig. 6) that can evaluate cement and casing thicknesses between ¾-in. and 1.2-in., in mud weights ranging from 7 to 18 lbm/gal in SOBM, and up to 16 lbm/gal in WBM. The tool, which uses a high-sensitivity, low-noise, low-frequency transducer, is available in low- and high-pressure versions: The low-pressure version (3 5/8-in.) is rated to 20,000 psi; the high-pressure tool (4.438 in.) is rated to 35,000 psi. Both can operate at 350°F.44
Fiberglass casing. Improvements in the operating temperature and pressure range of fiberglass casing, together with reduced cost, make it a viable option in oil and gas, disposal, groundwater monitoring, CO2 sequestration, saltwater injection, and geothermal wells. Fiberglass is lighter and more corrosion-resistant than steel, and performs well in temperatures and pressures up to 300°F and 4,000 psi. However, standard methods for evaluating cement bond in steel casing do not work in fiberglass casing due to its low acoustic properties, which are below the band limits of typical ultrasonic cement evaluation tools. Service companies are working on methods to enable ultrasonic cement evaluation in fiberglass casing. Schlumberger reported on preliminary research results.45
Weatherford has tested evaluation of cement bond and casing thickness, using a high-frequency, ultrasonic scanner system. The scanner uses the ratio of amplitudes between the echoes reflected from the casing ID/OD to measure the cement acoustic impedance. The technique provides a quantitative measure of the cement impedance with the same accuracy and resolution as the measurement performed with steel API casings. The time difference between the echoes measures the casing thickness.46
Since fiberglass casing is nonconductive, nonmagnetic resistivity and NMR logs can be used in EOR monitoring as an alternative to conventional saturation logs. NMR logs are useful in situations where EOR chemistry makes interpretation of these saturation logs difficult. Another advantage of NMR is the possibility of using a common physics of measurement at multiple scales. Schlumberger reported on a project in which laboratory coreflood and fiberglass-cased pilot and observation wells were monitored by NMR. The results indicated that NMR measurements, which are sensitive to fluid volume, can resolve remaining oil saturations to a precision of five saturation units in certain medium-viscosity oils, in porous formations.47
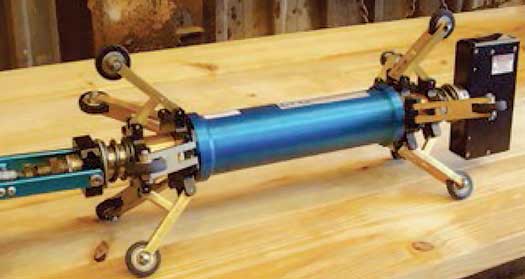
Laser tubular inspection. Laser Techniques Co. has introduced a novel laser scanning technology for surface tubular inspection that may be adaptable for downhole wireline service, Fig. 7. The system is called bore-erosion measurement and inspection (BEMIS)and is marketed by Laserstream through an exclusive arrangement. BEMIS employs a laser sensor that conveys information about steel erosion/corrosion, mechanical wear, eccentricity, and exact dimensions. The laser sensor rotates at high speed, as it is driven the length of a tubular, typically generating more than 2,500 data points per revolution. These data are used to generate a high-resolution, 3D map of the tubular inner 0.010 surface. Linear resolution can be as fine as .010-in. or as loose as 1-in., depending on the application. Typically, measurements are accurate to ±0.002-in.48
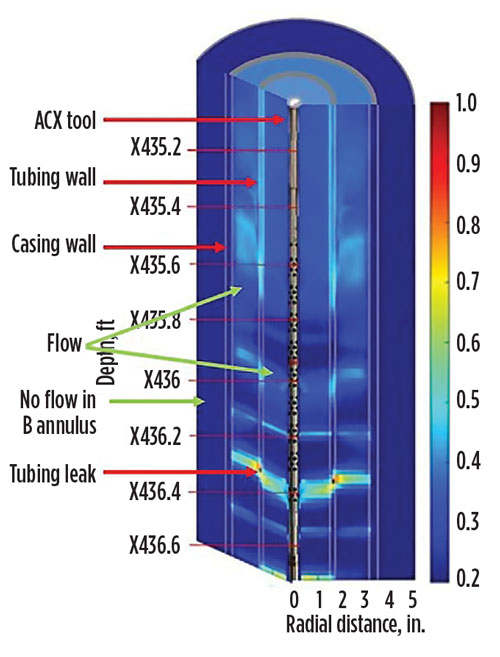
Leak detection. Halliburton introduced a system that uses a hydrophone array to locate and describe casing leaks and flow around the wellbore and behind casing (Acoustic Conformance Xaminer). The combined use of a receiver array and beamforming processing allows the array to triangulate on the sound/flow source and removes the high reliance on acoustic amplitude and frequency to accurately identify the leak point. Its results are superior to the unreliable, echo magnitude readings provided by previous generation tools.
High-definition data are stored downhole and can be downloaded at surface. The 1.69-in tool operates in continuous mode (25 ft/min.), to quickly identify areas with possible leaks, and in stationary mode to refine and confirm areas where leaks are identified. High-definition data stored downhole can be used in post-run data analysis that can provide flowrate and phase estimations at the locations with possible leaks, as well as 2D flow maps from which leak depth and radial location can be extracted, Fig. 8. In controlled testing, flowrates as low as 0.01 gal/min. have been identified. The tool is rated to 350°F and 15,000 psi. Minimum tubular inner diameter is 2 in.49,50
Reservoir monitoring. Borehole gravity meters are very sensitive to changes in the earth’s gravitational acceleration. In boreholes, they measure changes in fluid/rock density and can monitor fluid movement in reservoirs. However, the high cost and large size of these devices has previously restricted their use in E&P, and limited their application to vertical wells. But given recent development of smaller, low-cost MEMS-based, and vector gravimeters that can be run in deviated and horizontal wells, time-lapse (4D) gravimetric surveys may become a routine alternative to monitoring reservoir floods in the near future.51,52,53
EM visible proppants. Knowing the precise location of hydraulically placed proppants is critical for evaluating the success of stimulation and improving recovery on future frac jobs. Standard well-log-based methods using radioactive or new nonradioactive tracer proppant taggent are near-field techniques that detect proppant 18 in. to 24 in. from the borehole. Several university research groups are working on electromagnetic techniques that have potential for remote proppant detection and imaging. Central to these techniques is the use of electromagnetically visible proppant, Fig. 9. These include electrically conductive coating, nanoparticles, or contrast agents that can be detected by surface arrays or downhole methods, such as crosswell imaging or a low-frequency induction logging tool.54,55,56,57
Nanoparticle contrast agents. Two different groups of university researchers are investigating the use of nanoparticles to monitor production. The University of Utah is looking at nanoparticles (organic and inorganic) to enhance the electrical conductivity contrast between water and oil allowing it to be detectable by conventional induced polarization methods.58 The University of Texas at Austin group is studying the use surface-coated magnetic nanoparticles to change the magnetic permeability of the flood region; time-lapse crosswell tomography would be used to detect the low-frequency response (10 Hz) generated by a magnetic dipole source positioned in the injection well.71
WELLSITE ANALYSIS
Cuttings analysis. Attenuated total reflectance Fourier transform infrared (ATR-FTIR) spectroscopy is a common nondestructive laboratory technique that has application as a quick, non-complex, and cost-effective wellsite method for characterizing carbonate samples.
A study assessed the potential of ATR-FTIR for identifying and quantifying carbonate rock mineralogy and demonstrated it is comparable with XRD. However, ATR-FTIR requires no special sample preparation. Once equipment is available, there is no additional cost to run samples. Mineral identification and semi-quantification take less than 5 min. This compares favorably to XRD analysis, at $350 to $500 per sample The semi-quantification of mineral concentrations may allow ATR-FTIR to serve as proxy for assessing the brittleness/fracability index of unconventional reservoirs.59
Continuous XRF analysis. X-ray fluorescence is an established, rapid, nondestructive analytical technique for evaluating rock samples. Nexen Energy started a program to routinely perform continuous XRF analysis of cuttings and core from its pad horizontal wells to optimize completion and fracing programs. Acquisition of the XRF dataset has been significantly more cost-effective (compared to XRD), and also resulted in a substantial increase in the understanding of reservoir properties. The dataset resides in the common data repository, and is accessed for use in a variety of geoscience and engineering applications.60,61
Magnetic susceptibility measurements can identify lithological variations, estimate mineral content, and correlate with key petrophysical properties. These nondestructive measurements are used to characterize core 62,63 and also offer a method to rapidly characterize drill cuttings at the wellsite or laboratory.64,65
SCIENTIFIC
Weatherford Labs and Enthought participated in a study of core recovered from the central Chicxulub crater, offshore Mexico’s Yucatan peninsula. The crater is believed to be the site of the collision of an asteroid that resulted in the mass extinctions at the end of the Cretaceous period. Recovered samples were scanned, using dual-energy CT and Enthought’s virtual core software to create 3D digital representations. The software includes detection and visualization capabilities for analyzing the composition and structure of the core.66
Seabed-based drilling and logging platforms. Operators are seeking ways of reducing cost related to deepwater drilling, particularly in marginal fields. Self-contained robotic systems operating directly on the seafloor offer a method for drilling shallow site-investigation boreholes, intermediate depth research boreholes, and, potentially, deeper exploration and production wells.
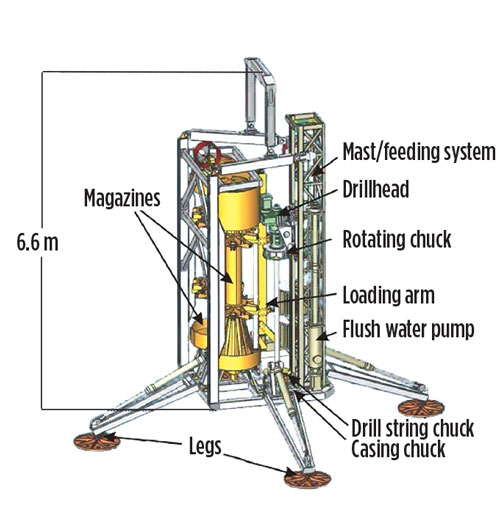
The MARUM-MeBo70 remotely operated seabed drilling system, developed by the Marum Center for Marine Environmental Sciences at the University of Bremen, can core and log shallow scientific boreholes, Fig. 10. This system can operate in water depths down to 2,000 m, and can sample sediments and hard rocks down to 80 m below the seafloor. Core diameter can vary from 55 to 84 mm. Total length can exceed 70 m. The system comprises a drilling rig, winch with 2,500 m of steel-armored umbilical, control cabin, drill-tool container, workshop container, and the launch-and-recovery system. The logging-while-tripping memory probes include dual induction, magnetic susceptibility, optical imaging, acoustic, and spectral gamma ray.67,68
Benthic’s portable, remotely operated drill can switch dynamically between piston sampling, rotary coring, and in-situ testing. Drilling is controlled by robotic actuators. Two rotary magazines hold up to 260 m of combined sampling barrels, test tools, rods and casing, enabling penetration depths in excess of 130 m, sub-seabed. Core length is 2.75 m/barrel, and piston and rotary core diameters range from 44 to 75 mm, depending on the system used. The system also can do simple methane gas analysis. Systems are available for water depths down to 3,000 m.69 The Badger Explorer, a robotic seafloor drilling/logging system for drilling deep boreholes and appraising and monitoring them, is still in development.”70 ![]()
REFERENCES
1. Wethe, D., “Oil industry growing again after losing half-million jobs Bloomberg,” January 9, 2017
2. Rider, Malcolm, and M. Kennedy, The Geological Interpretation of Well Logs, 3rd Edition, Rider-French, ISBN 9788-0-9541906-8-2, 2011
3. Bateman, R.M., Openhole Log Analysis and Formation Evaluation, 2nd Edition, SPE, 978-1-61399-156-5, 2012
4. Bateman, R.M., Cased-Hole Log Analysis and Reservoir Performance Monitoring, 2nd Edition, Springer, ISBN 978-1-4939-2067-9, 2015
5. Peters, E, 2012, “Advanced Petrophysics,” v. 1-3, Live Oak Book Company, ISBN 978-1-936909-44-5 (v. 1), 978-1-936909-46-9 (v. 2), 978-1-936909-48-3 (v. 3)
6. Kennedy, M., 2015, “Practical Petrophysics,” Elsevier, Developments in Petroleum Science 62, ISBN 978-0-444-63270-8
7. McPhee, C., Reed, J., and Zubizarreta, I., 2015, “Core Analysis: A Best Practices Guide,” Elsevier, Developments in Petroleum Science 64, ISBN 978-0-444-63533-4
8. Tiab, D., and Donaldson, E.C., 2015, “Petrophysics,” 4th Edition, Elsevier, ISBN 978-0-012803-188-9
9. Ma, Y.Z., and S.A. Holditch, Unconventional Oil and Gas Resources Handbook; Evaluation and Development,” Elsevier, ISBN 978-0-12-802238-2, 2016
10. Bultreys et al., 2016, “Imaging and image-based fluid transport modeling at the pore scale in geological materials: A practical introduction to the current state-of-the-art,” Earth-Science Reviews, 155, 93–128.
11. Milliken, K.L., and M.E. Curtis, “Imaging pores in sedimentary rocks: Foundation of porosity prediction,” Marine and Petroleum Geology, 73, 590–608, 2016
12. Zhang et al., 2016, “The brittleness indices used in rock mechanics and their application in shale hydraulic fracturing: a review,” Journal of Petroleum Science and Engineering, 143, 158–170.
13. Jamieson, A., 2012, “Introduction to Wellbore Surveying,” version 05.08.16, University of the Highlands & Islands (UK). https://www.uhi.ac.uk/en/research-enterprise/wellbore-positioning-download
14. Wu et al., “A new well positioning technique: Access independent ranging solution for providing accurate well completion,” SPE Paper 181436 presented at the SPE Annual Technical Conference and Exhibition, Dubai, UAE, Sept. 26–28, 2016
15. Chao, D., and N. El-Sheimy, “Continuous measurement-while-drilling surveying system utilizing low-cost SINS,” SPE/IADC Paper 178154 presented at the SPE/IADC Middle East Drilling Technology Conference and Exhibition, Abu Dhabi, UAE, January 26–28, 2016
16. Naveed et al., “Tight TVD control on Australia’s North West Shelf through a cutting edge solution high-definition surveying,” SPE Paper 182472 presented at the SPE Asia Pacific Oil and Gas Conference and Exhibition, Perth, Australia, October 25–27, 2016
17. Abughaban et al., “Advanced trajectory computational model improves calculated borehole positioning, tortuosity and rugosity,” IADC/SPE Paper 178796 presented at the IADC/SPE Drilling Conference and Exhibition, Fort Worth, Texas, USA, 1–3 March, 2016
18. Monterrosa et al., “Analysis of the impact on drilling performance of the RPM on cessation method of MWD surveying under MPD operations,” SPE/IADC Paper 179744 presented at the SPE/IADC Managed Pressure Drilling and Underbalanced Operations Conference and Exhibition held in Galveston, Texas, USA, April 12–13, 2016
19. National Oilwell Varco, “BlackStar II Dual-Telemetry MWD Tool; tool specifications,” brochure NOV-DD5-TSF-1518-001. http://www.nov.com/WorkArea/DownloadAsset.aspx?id=25547, 2016
20. Parker, T., and P. Cooper, “Taking the heat: logging while drilling at extreme temperatures,” IADC/SPE Paper 180592 presented at the IADC/SPE Asia Pacific Drilling Technology Conference, Singapore, August 22–24, 2016
21. Constable et al., 2016, Looking ahead of the bit while drilling: from vision to reality,” Petrophysics, 57(5), 426–446.
22. Nwosu et al., “Enhancing shale reservoir completion design using oriented unipole logging while drilling sonic measurements in horizontal well,” UU Paper presented at the SPWLA 56th Annual Logging Symposium, Long Beach, California, USA, July 18–22, 2015
23. Halliburton, “Halliburton introduces largest hole-size LWD density service in the oil and gas industry,” press release August 15, 2016
24. Bachmann et al., “A new large hole nuclear magnetic resonance logging while drilling tool for early stage formation evaluation,” HH Paper presented at the SPWLA 57th Annual Logging Symposium, Reykjavik, Iceland, June 25–29, 2016
25. Yang et al. “LWD resistivity imaging in invert emulsion oil-based drilling fluid,” URTeC Paper 2428629 presented at the Unconventional Resources Technology Conference, San Antonio, Texas, USA, August 1–3, 2016
26. Indo et al., “Evaluating formation fluid properties during sampling-while-drilling operations,” SPE/IADC Paper 173152 presented at the SPE/IADC Drilling Conference and Exhibition, London, United Kingdom, March 17–19, 2015
27. Cartellieri et al., “Multi-sensor fluid typing for improved predictions during sampling operations,” RRRR Paper presented at the SPWLA 57th Annual Logging Symposium, Reykjavik, Iceland, June 25–29, 2016
28. Akue et al., “Openhole tractor and high-tension conveyance package reduces HSE risk and saves 3 days of rig time for formation fluid sampling in a highly deviated well,” IADC/SPE Paper 170565 presented at the IADC/SPE Asia Pacific Drilling Technology Conference, Bangkok, Thailand, August 25–27, 2014
29. Bolshakov et al., “Deep fracture imaging around the wellbore using dipole acoustic logging,” SPE Paper 146769 presented at the SPE Annual Technical Conference and Exhibition, Denver, Colorado, USA, October 30–November 2, 2011
30. Patterson et al., “New acoustic acquisition and processing method assist in delineating structure in an exploration play in the Gulf of Mexico,” NNNN Paper presented at the SPWLA 57th Annual Logging Symposium, Reykjavik, Iceland, June 25–29 June 2016
31. Ye, S.-J., “A robust automatic dip picking technique to improve geological interpretation and post-drill formation evaluation of azimuthal wellbore image logs,” SPE Paper 183134 presented at the Abu Dhabi International Petroleum Exhibition & Conference, Abu Dhabi, UAE, November 7–10, 2016
32. Bammi et al., “A new slim full bore electrical micro-imaging tool conveyed through the drill string and bit for geological and reservoir characterization of unconventional reservoirs,” URTe Paper 2430509 presented at the Unconventional Resources Technology Conference, San Antonio, Texas, USA, August 1–3 August 2016
33. Weatherford, “Compact spectral gamma ray tools,” company website, 2016
34. Tijs et al., “Towards a global network of gamma-ray detector calibration facilities,” published in Exploration Geophysics, 47, 302–307, 2016
35. Elshahawi et al., “Current state and future trends in the use of downhole fluid analysis for improved reservoir evaluation,” SPE Paper 181550 presented at the SPE Annual Technical Conference and Exhibition, Dubai, UAE, Sept. 26–28, 2016
36. Ramaswami et al., “Extracting more from wireline formation testing: better permeability estimation,” IPTC Paper 18914 presented at the International Petroleum Technology Conference, Bangkok, Thailand, Nov. 14–16, 2016.
37. Kim et al., “Best practices for obtaining representative formation water samples using formation testers,” SPE Paper 181549 presented at the SPE Annual Technical Conference and Exhibition, Dubai, UAE, Sept. 26–28, 2016
38. Niewuwoudt, H., “Wireline formation pressure testing benefits extended to low-mobility environments,” published in World Oil, 237(10), 75–78, 2016
39. Weatherford, “Compact formation pressure tester with sampling,” company website, 2016
40. Hu, Y., and W. Guo, “Behind-casing cement void volumetric evaluation,” SPE Paper 178447 presented at the SPE Thermal Well Integrity and Design Symposium, Banff, Alberta, Canada, Nov. 23–25, 2015
41. Hu, Y., and W. Guo, 2016, “Behind casing inspection using active gamma-gamma technique,” OTC Paper 26639 presented at the Offshore Technology Conference Asia, Kuala Lumpur, Malaysia, March 22–25, 2016.
42. Klieber et al., “Leading edge developments in ultrasonic logging improves cement evaluation quality in extreme conditions,” SPE Paper 182533 presented at the SPE Annual Caspian Technical Conference & Exhibition, Astana, Kazakhstan, Nov. 1–3, 2016
43. Thierry et al., “New-generation ultrasonic measurements for quantitative cement evaluation in heavy muds and thick-wall casings,” SPE Paper 181450 presented at the SPE Annual Technical Conference and Exhibition, Dubai, UAE, Sept. 26–28 2016
44. Mandal, B., “Well integrity assurance through heavy borehole fluid and thick casing: a challenge of ultrasonic evaluation,” MMM Paper presented at the SPWLA 57th Annual Logging Symposium, Reykjavik, Iceland, June 25–29., 2016.
45. Edwards et al., “Cement evaluation of fibre-reinforced plastic casing for EOR observation,” SPE Paper 169890, presented at the SPE EOR Conference at Oil and Gas West Asia, Muscat, Oman, March 31–April 2, 2014
46. Tello et al., “A new and innovative high frequency ultrasonic method for evaluating cement bond and casing thickness in wells with fiberglass casing applied in the French Paris Basin,” BBB Paper presented at the SPWLA 57th Annual Logging Symposium, Reykjavik, Iceland, June 25–29, 2016
47. Al-Yaarubi et al., “Field experience of NMR logging through fiber-reinforced plastic casing in an EOR observation well,” PPP Paper presented at the SPWLA 56th Annual Logging Symposium, Long Beach, California, USA, July 18–22, 2015
48. Laser Techniques Company, 2016(?), “BEMIS pipe inspection systems,” company brochure.
49. Walters et al., “Locating and imaging leaks using new acoustic array technology,” SPE Paper 183009 presented at the Abu Dhabi International Petroleum Exhibition & Conference, Abu Dhabi, UAE, November 7–10, 2016
50. Halliburton, “Acoustic Conformance Xaminer (ACX) service,” brochure H011959, 2016
51. Nind, C.J.M., and J. D. MacQueen, “The borehole gravity meter: development and results,” P124 Paper presented at the Society of Petroleum Geophysics 10th Biennial International Conference & Exposition, Kochi, India, Nov. 23–25, 2013
52. Krahenbuhl et al., “Improved recovery of fluid movement through time-lapse borehole vector gravity,” GME Paper P1.3, SEG Expanded Abstracts 2014 Program, 1348–1352, 2014
53. Middlemiss et al., “Measurement of the Earth tides with a MEMS gravimeter,” published in Nature, 137, 614–629, 2016
54. Aderibigbe et al. “Detection of propping agents in fractures using magnetic susceptibility measurements enhanced by magnetic particles,” SPE Paper 170818 presented at the SPE Annual Technical Conference and Exhibition, Amsterdam, The Netherlands, Oct. 27–29, 2014
55. Basu, S., and M.M. Sharma, “A new method for fracture diagnostics using low frequency electromagnetic induction,” SPE Paper 168606 presented at the SPE Hydraulic Fracturing Technology Conference, The Woodlands, Texas, USA, Feb. 4–6, 2014.
56. LaBrecque et al. “Remote imaging of proppants in hydraulic fracture networks using electromagnetic methods: result of small-scale field experiments,” SPE Paper 179170 presented at the SPE Hydraulic Fracturing Technology Conference, The Woodlands, Texas, USA, Feb. 9–11, 2016.
57. Palisch et al. “Recent advancements in far-field proppant detection,” SPE Paper 179161 presented at the SPE Hydraulic Fracturing Technology Conference, The Woodlands, Texas, USA, Feb. 9–11, 2016
58. Burtman et al. “Feasibility study of application of nanoparticles I complex resistivity (CR) reservoir monitoring,” Paper EM-P1.1, SEG Expanded Abstracts 2015 Program, 963–967, 2015
59. Henry et al. , “Assessing and calibrating the ATR-FTIR approach as a carbonate rock characterization tool,” Sedimentary Geology, 347, 36–52, 2017
60. Chatellier et al., 2015 “Lessons from high-resolution continuous XRF on stratigraphy and geomechanics of shale,” AAPG Search and Discovery Article No. 41656.
61. Thurston, D. et al., Logging for free—the use of XRF on cutting data in unconventional oil and gas exploration and reservoir characterization,” WWW Paper presented at the SPWLA 57th Annual Logging Symposium, Reykjavik, Iceland, June 25–29, 2017
62. Potter, D.K., “Magnetic susceptibility as a rapid, nondestructive technique for improved petrophysical parameter prediction,” Petrophysics, 48(3), 191–201, 2007
63. Agbo, B.C., and D.K. Potter, “Novel high resolution probe magnetic susceptibility and comparison with wireline gamma ray and grain size in an Albertan oil sand well,” RC Paper E-P1.3, SEG Expanded Abstracts 2014 Program, 2590–2594, 2014
64. Mena, M., and A.M. Walther, “Rock magnetic properties of drill cutting from a hydrocarbon exploratory well and their relationship to hydrocarbon presence and petrophysical properties,” in Elmore, R.D. et al. (eds.), Remagnetization and chemical alteration of sedimentary rocks, Geological Society, London, Special Publications, 371, 217–228, 2012
65. Ali et al., “Magnetic susceptibility of drill cuttings in a North Sea oil well: a rapid, nondestructive means of characterizing lithology,” SCA2015 Paper 036 presented at the SCA International Symposium, St. John’s, Newfoundland and Labrador, Canada, August 16–21. 2015
66. Weatherford Labs, “Weatherford Labs, Enthought to analyse creater core tied to dinosaur extinction event,” press release, June 21, 2016
67. Kopf et al., “Simple, affordable and sustainable borehole observatories for complex monitoring objectives,” published in Geoscience Instrumentation, Methods and Data Systems, 4, 653–681, 2014
68. Freudenthal, T., and V. Ratmeyer, “Remote drilling in the deep sea: the sea floor drill rig ‘MeBo’,”presentation at the International Research Ship Operators Meeting, INMARTECH, Toulon, France. http://wwz.ifremer.fr/inmartech08/content/download/24259/343971/file/Session4-Ratmeyer-MeBo.pdf, 2008
69. Smith et al. “Rotary rock coring and drilling data parameters from a seafloor-based drilling technology—a case study,” Paper OTC-25997 presented at the Offshore Technology Conference, Houston, Texas, USA, May 4–7, 2015.
70. Jacobs, T., “Breaking from the norm to reach marginal offshore fields,” published in Journal of Petroleum Technology, 68(7), 27–33, 2016
71. Rahmani et al., 2015, “Crosswell magnetic sensing of superparamagnetic nanoparticles for subsurface applications,” SPE paper SPE-166140, SPE Journal, 20(5), 1067–1082.
- Applying ultra-deep LWD resistivity technology successfully in a SAGD operation (May 2019)
- Adoption of wireless intelligent completions advances (May 2019)
- Majors double down as takeaway crunch eases (April 2019)
- What’s new in well logging and formation evaluation (April 2019)
- Qualification of a 20,000-psi subsea BOP: A collaborative approach (February 2019)
- ConocoPhillips’ Greg Leveille sees rapid trajectory of technical advancement continuing (February 2019)

