Delivering on the promise of digital transformation
Today’s digital innovation is driving what many say is the fourth industrial revolution (Industry 4.0). It’s reshaping industries, disrupting business models and operating practices, and transforming business ecosystems. Digital disruption is impacting industries in different ways. Retail and distribution businesses are capitalizing on innovation to transform customer engagement. In the manufacturing sector, advanced technologies, such as the Internet of Things, automation, analytics and artificial intelligence, are reshaping the way that organizations operate.

Companies that can increase digital fluency create value throughout the enterprise—and they typically dominate in most markets. The Boston Consulting Group says, “…companies with high technology intensity have high gross margins.” Accenture also reports, companies that understand digital transformation earn 26% more profit than others. Most executive teams understand this, and they recognize the power of technology to change the rules of engagement for their business. So why, despite a history of technology investment, isn’t the oil and gas industry experiencing the same disruption from digital innovation?
BP Group CEO Bob Dudley (Fig. 1) has questioned the lack of progress in the industry by asserting, “we are still so far behind in this area. Much progress remains.” Digitization and sensors are playing large roles in BP’s operations, especially on upstream platforms, Dudley said. “This will change the way people work.”
The question remains, how will it change the way we work? Changing the way that oil and gas companies operate requires everyone, from the deck-plate to the boardroom, to make better decisions. To make better decisions, people need to be better informed and better connected.
NEED FOR ACTIONABLE INSIGHTS
Part of the promise of digital transformation is the potential for big data and analytics to provide actionable insights. With smart, connected devices, we have more data than ever. How can we take advantage of the Industrial Internet of Things (IIoT) when, as one senior executive put it, we are looking for “more insight and less data?”
Forrester reports, 74% of firms say they want to be “data-driven,” but only 29% are successful at connecting analytics to action. Figure 2 describes how Gartner views the steps in the big data journey—from the simple ability to describe a situation through to decision automation.
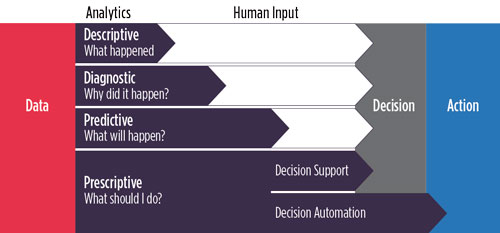
Before we can automate decisions, we need to understand what happened, why it happened, and be able to reliably predict what will happen. To do that, we must be able to connect everyone with the correct data, in the right context, and using commonly understood language.
Industries that have realized the benefits of the digital revolution, such as retail, travel, entertainment, etc., have the advantage of well-defined data models and common data. Customers, airline seats, destinations, payments and currency are universal standards, and the relationships between them are well-understood. This provides a solid foundation on which to build analytics and predictive capabilities. There is an ever-growing amount of well-recognized and connected data in these industries that can be analyzed for new patterns and insight, to better support, or even automate, critical decisions resulting in improved business.
Essentially, when we understand what the data are telling us, we can utilize decision support tools reliably and move, eventually, to decision automation. In managing oil and gas operations, we have achieved automation in some parts of our business, specifically machines and process equipment. Other business processes, such as operations, maintenance and process safety, rely heavily on human input. As a result, we struggle to achieve efficiency and manage risk appropriately.
Unfortunately, in these and other areas of our industry, we are burdened with many sources of disparate data, often generated by vertical, functional silos. This results in messy, ill-defined data models that are difficult to access and understand. Attempts to resolve this challenge have led to ever-growing levels of complexity, where even the experts struggle to find understanding. Dashboards targeted at senior leadership merely collate data, which many find difficult to relate to the reality of their business, prompting the request for more insight and, ironically, less data.
This is not a new phenomenon when managing risk. MIT Professor of Aeronautics and Astronautics Nancy Leveson’s observations on the space shuttle Columbia disaster provide insight into this issue:
“In some organizations, the desire to predict the future leads to collecting a large amount of information based on the hope that something will be obtained that is useful. The NASA Space Shuttle program was collecting 600 metrics a month, for example, right before the loss of the Columbia, none of which turned out to be helpful in predicting the loss or identifying the clear migration of the program to states of increasing risk.”
Simply integrating existing data is not the answer to providing insight. We need to be able to connect the data to the operational reality of our businesses. We also need to understand where there are gaps in our data. We must translate, aggregate, and visualize data in new and innovative ways. The key to this is determining a common currency for the disparate sources of data. This common currency unlocks the potential in data that’s typically hidden away in silos and provides meaningful relationships between previously disparate data sources.
When businesses foster a collaborative culture and a disciplined approach to decision-making, the organization as a whole can support key business objectives—including risk, productivity, and cost management. In practice, oil and gas operators need to know what’s happening, when it’s happening, and where it’s happening on the asset—real-time insight. What’s required is a joined-up way of visualizing and managing all risk and activity, right across the organization. Bringing together these once-disparate pieces of information provides a holistic view of the operational reality of the facility.
When this information is made accessible to the organization, everyone has the context that they need to make better, more informed operational decisions that drive fundamental improvements to business objectives. As said in a previous World Oil article, “To transform [the oil and gas] industry, we must adopt an operations excellence mentality and leverage emerging technologies with data-driven innovation, in a holistic manner.”
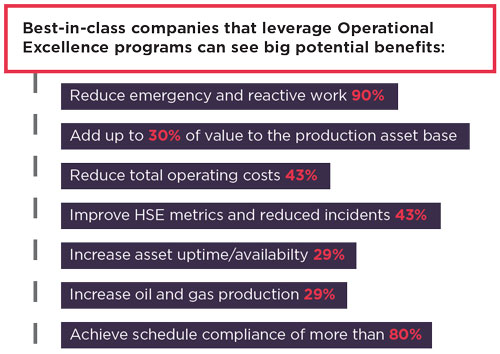
Oil and gas must advance from incremental, digitally-driven operational improvements to a broader adoption of enterprise technology that supports operational excellence. Operational excellence requires everyone, from the boardroom to the frontline, to consistently make the most effective decisions, based on an integrated view of an asset’s operational reality, in terms of risk, cost and productivity, Fig. 3.
MANAGING RISK IS PARTICULARLY TRICKY
Let’s look at one area, common to all those operating in hazardous industries, which requires digital disruption—risk management. Understanding the potential sources of operational risk, and how they can accumulate, is a key challenge that requires a “common currency” approach to the disparate sources of data. Operational risks impact the bottom line. But the dynamic nature of risk makes it difficult to connect the performance of our safety systems and processes in a meaningful way to the operational reality of the business.
The reality is, at the front line, people intervene dynamically to operate, maintain, inspect and fix equipment on the asset. It’s where systems operate, where people are hurt, and equipment is damaged. It’s also where new hazards are introduced that can potentially impact the state of the asset. By its very nature, it’s a dynamic and inherently dangerous place to work and manage. Understanding and managing risk is paramount, Fig. 4.
Information on the multiple components of risk is managed in different parts of the organization, held in silos, inaccessible for the majority in a useful way. As a result, a holistic, up-to-date view of risk is not available automatically to decision-makers. Instead, they are forced to resort to manual searches for the relevant data and rely on their experience and instincts to judge when situations become unsafe. To gain visibility and control of risk and ensure operational continuity, operators need to make sure everyone across the business understands and manages risk based on the same criteria—and has a practical understanding of how their decisions directly or indirectly influence the risk picture.
Conceptual models like James T. Reason’s Swiss Cheese and the process safety Bow-Tie methodology have been developed, in an attempt to describe the inter-related nature of operational risk. These work well in a design phase, but the industry has yet to develop operational systems that enable routine management of operational risk on a day-to-day basis for anything other than major, single-source risk scenarios. Attempts to do so fall into the trap of complexity, or result in generalized historical performance indicators—which do not help inform decisions on current or future risks.
What is required is a simple, elegant approach that enables hazardous industry operators to collectively focus on the elements of risk that are most important.
THE SOLUTION
Innovative thinking, combined with new technology platforms to support operational excellence, are, however, offering an alternative approach. Here, once-disparate and complex risk data are translated, aggregated and made available—in real-time, based on a common currency. Displayed in an interactive, dynamic barrier management model, this simple, elegant approach to operational risk management connects process safety and risk control system performance to frontline operations at any given point in time. The approach is practical, and it makes major accident risk exposure visible, prominent and available for everyone in real time.
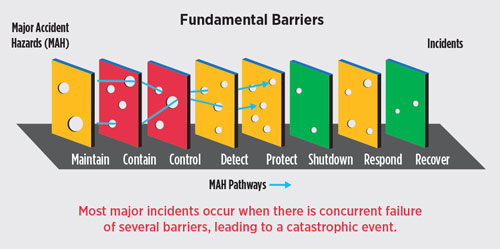
It is true that when most major incidents occur, there is a concurrent failure of several barriers, also known as layers of protection, Fig. 5. The degree of impairment, and the number of successive barriers compromised, represents a level of risk. But that risk only matters if it is set to occur at a certain time, in a certain area. That is why the approach to operational risk management must be dynamic.
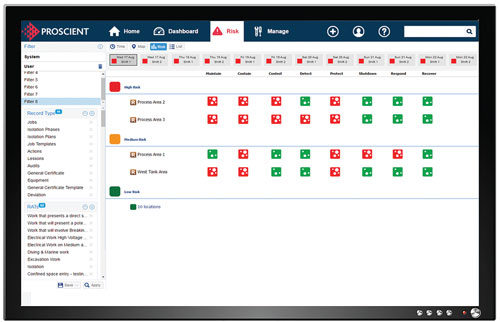
Key to the solution’s effectiveness is the unique visualization of data in real time, which did not exist before. This distills to effectively three different views of the data—time, space and risk, Fig. 6.
- In space, an operator can see the facility layout with icons indicating how activities and facility impairments align, changing the risk levels. Highlighted areas represent high risk for current and future shifts.
- In time, traditional Gantt charts display sequenced activities, facility deviations and scheduling conflicts. Indicators of high or medium levels of risk are shown for current and future shifts.
- In risk, for each shift, the areas where high or medium risk is predicted are shown, along with a picture of the specific barriers impaired. Tools to “simulate fix” enable quick testing, to see the impact of deciding to repair specific impairments or to defer activities.
All are examples of actionable insights, where data are presented in a way that supports decisions on activity commencement, and schedule priorities and facility operations across the business. And there’s value for all.
- Frontline operations are provided easy-to-read, data-rich status of equipment and activities, with context to make better-informed, risk-dependent decisions during the shift.
- Site management and planners looking further ahead have access to tools that show the risk implications of scheduling decisions, protracted deviations and planned activities, as well as “what-if” scenarios.
- Asset leadership can see, for the first time, risk levels, facility productivity and plan-attainment trends. They can compare asset performance and, where necessary, dive into the data, to see what is generating the highest levels of risk.
- Executives can look across the enterprise and compare asset performance, gaining greater insight into how risk is managed across the whole organization.
REAL-LIFE USE CASES
This approach, while a journey, offers context for key operational decisions at various levels, in support of strategic objectives for oil and gas operators around the world. Here are a couple of real-life examples where this approach is being adopted.
North American offshore production platform. This North American offshore operator recognized a gap between the real-time risk information understood on the facility, and that shared with senior leadership onshore. As such, they’ve begun to deploy a common approach to risk management, driven by activities, energy isolations, temporary defeats and deviations, such as management of change (MOC).
The goal is three-fold: Align the site leadership in more structured, risk-based decisions. Engage frontline workers in process safety and barrier health, to raise awareness and develop more rigorous scrutiny of safeguards on the facility. Provide onshore leadership with a window into real-time risk decisions.
For this operator, the appeal of a platform-approach to risk management is complete visualization of risk and activity in near-real time to everyone across the organization. The ability to see ongoing or planned activities next to deviations in risk control systems is something new and of immense value. The organization is now beginning to use real insights to make daily planning decisions based on minimizing risk in the forward schedule.
Large onshore integrated facility in the Middle East. In another example, in preparation for running a large onshore operation in the Middle East, an operator is using an operational excellence platform as a risk advisory and activity management tool.
The platform is integrated with the operator’s maintenance management system (MMS) and equipment status historian. For short-term schedule optimization, the platform displays high-risk areas in future shifts, 14 days ahead, based on deviations captured from the historian, as well as planned activities based on the maintenance schedule. This schedule is optimized, based on resource utilization.
Within the operational excellence platform, the execution of maintenance and those activities associated with the maintenance schedule are managed, such as removing equipment from service, de-pressuring, draining and purging, and installing energy isolations. Also included are ancillary activities, such as scaffolding erection and crane utilization.
Once built, the full schedule can be checked. Where necessary, it can be optimized based on expected risk levels. The revised schedule is then synchronized with the MMS.
When the time comes, the operational excellence platform can help manage operational activities and permitted work.
The same views of time, space and risk provide real-time visualization of what is happening on the asset, in terms of activity and risk.
CONCLUSIONS
These are changed times from the 1970s and 1980s when the first wave of the digital revolution started to impact oil and gas. Then, global organizations pioneered mainframe networks, powerful simulators and communications technologies such as email, fax machines and cellular phones. Life at work was very different from life at home.
This position has now reversed, with consumer technologies outpacing business solutions in many sectors such as our own. This is creating a challenge in our industry, where workers crave some of the technologies that they have become accustomed to in their private lives.
The digital revolution has the promise to radically change the way people work. To achieve this, we need to convert the ever-growing sources of data provided by the Industrial Internet of Things into actionable insights. This requires a simpler approach that creates common currencies from disparate sources of data. There is a growing number of examples, where this approach is helping people throughout the organization make better decisions
We often think the complexity of business is a modern-day concept brought on by the interconnected world and data overload. The truth is that we have been struggling with it for a long time. As such, it is encouraging to reflect on the wisdom of Winston Churchill, who said, more than a half-century ago, “out of intense complexities, intense simplicities emerge.” ![]()

