Beating the decline through refracturing

There is, it seems, a constant refrain, in this post-oil-price-rout environment, about the survival of shale operators and, by extension, their suppliers. The immediate need is to cut costs across the board. Yet, even more important is the need to maintain—and even increase—production from existing assets. The decline curve in unconventional reservoirs is steep, a trend typically countered by the drilling and completion of new wells, which is both costly and time-consuming. At current oil and gas prices, in many cases, completing new wells does not provide the requisite Internal Rate of Return (IRR) to pass economic muster.
Enter refracturing. A few years after coming onstream, most horizontal shale wells produce at a fraction of their initial rates, leaving large volumes of unrecovered oil and gas in the rock. These bypassed reserves could be accessed through refracturing. While this is not a new technique, it is one that is being used more and more, because of the oil price decline. Vertical wells have been refractured since the mid-1990s, but with mixed results, earning it the nickname “pump and pray.” However, the industry’s understanding of fracturing and horizontal completions evolved during the shale boom to such an extent, that the techniques and technologies now available certainly can play a key role in the efficient application of refracturing in horizontal wells. In fact, according to conservative estimates as many as 75,000 wells in the U.S. could be candidates for a second wave of fracturing.
Refracturing provides a simpler, more logical and lower-cost alternative to drilling new wells. If output is declining in an oil or natural gas well, and fracturing the well provided sizeable production, then repeating the process, on the same well, should provide another boost to production and ultimate recovery. The likelihood of enhancing recovery is supported even further by the fact that many of the first- and second-generation unconventional wells were drilled with fewer stages, and with less proppant, than is commonplace today. With a higher density of perforation clusters and larger volumes of proppant used for refracturing, it is conceivable that these older wells would see a significant boost in production, at a much lower investment.
However, stimulating new rock by refracturing is not without its challenges, particularly for today’s long horizontal wells with multi-stage completions. Most refractures today are done without mechanical isolation, opening all stages and perforation clusters to fluid flow, thus posing several questions:
- Which part, or parts, of the old well will benefit from refracturing?
- Did the refracturing open new fractures, or just reopen existing, depleted fractures?
- How can selected stages be isolated, and only those stages be refractured? What tools/techniques are available for mechanical isolation?
- In the absence of mechanical isolation, are diverters working to isolate and move the refracturing down the well? Is the entire wellbore being restimulated or just portions of it?
- How does the new stimulated rock volume (SRV) differ from the SRV achieved in the first stimulation? Does it really add to the original estimated ultimate recovery, or only provide a temporary boost in production?
These questions are fundamental to the decision to refracture. Refracturing opportunities range from remedial work—which fixes stages that were not completed properly or where proppant flowed back into the well—to enhancing recovery through the reenergizing of the fracture network, creating a new network for delivery of production-enhancing chemicals. In all cases, the success of the refracture will first need to be modeled, within the context of the specific project, and diagnosed, through the use of measurement techniques, such as microseismic monitoring. Successful implementation of just such refracturing programs will help us, as an industry, beat the decline.
REFRACTURING CHALLENGES
The Barnett, Eagle Ford, Haynesville and Bakken are among the oldest of the shale plays, with large inventories of wells that have been on production for several years. Pilot refracturing programs have been underway in these plays; with operators becoming more adept at identifying high-quality refracturing candidate wells, and applying smart operating practices to enable successful refracturing. It is expected that wells in these plays will benefit the most from refracturing, since the oldest wells present opportunities to apply knowledge that came later in a play’s life, such as cluster spacing, impact of fluid type and proppant volumes. While refracturing, generally, results in increased production, one question remains unanswered: Is the refracturing creating new fractures, or is it reactivating old depleted fractures?
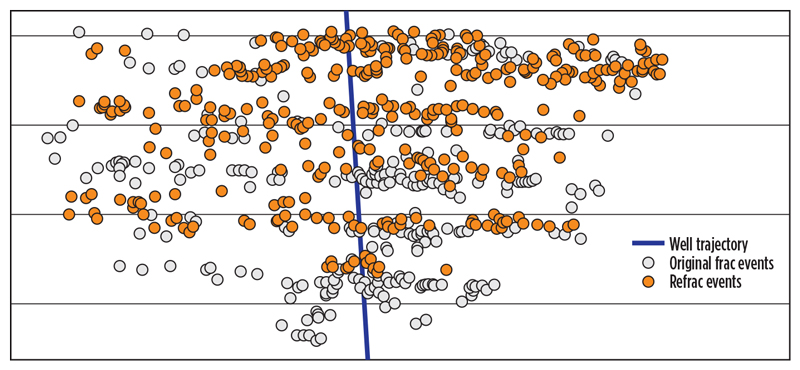
To gain an understanding of where new rock is being stimulated, we need to look at an example, where surface microseismic data have been acquired during the original frac, as well as when the well was refractured, after several years of production. The two time-lapse data sets (Fig. 1) are very consistent, with similar spatial bias and uncertainty in the event positioning, allowing for direct, accurate comparison of the microseismic data from the two acquisitions.
The microseismic data acquired during the refracture determine several trends that correlate with the original microseismic data, suggesting re-activation of depleted fractures. Microseismic activity is also apparent in regions that did not demonstrate any such activity during the original frac, indicating the creation of new fractures. The results also indicate that, generally, the refracture azimuth is the same as the original frac, with limited evidence of fracture re-orientation during the refracturing. While studies suggest a possibility of fracture re-orientation during refracturing, it is typically a function of the time elapsed between the original fracturing and the refracture. It has also been observed that the longer the duration between the original fracture and refracture, the lower the possibility of fracture re-orientation. This is an important consideration when selecting candidates for refracturing. Changes in stress orientation can significantly alter the results and success of the refracture.
The case study represented in Fig. 1 had the advantage of the original hydraulic fracturing results to compare against. Hence, in addition to understanding the spatial and temporal distribution of the overall refracturing program, the microseismic information and associated completion evaluation provided real-time information about the portions of the program that contributed to the stimulation of new drainage areas. In most cases, however, microseismic technology was not used in the initial fracture stimulation for time-lapse determination, so those data are not available. Microseismic events that relate to stimulating new rock during a refracturing program can be differentiated by integrating the results with treatment pressure analysis, particularly net pressure and initial shut-in pressure (ISIP).
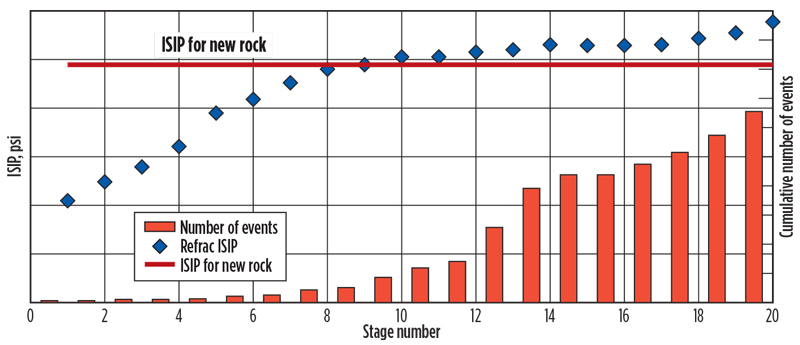
Figure 2 shows a plot of the ISIP and microseismic events during the refracture. The x-axis shows the stage number during the refracture. The primary vertical axis on the left shows the ISIP computed for every stage. The solid red line shows the ISIP recorded during the original frac job, representing the virgin rock stress. The secondary vertical axis, on the right, shows the cumulative microseismic event count.
It takes several pumping cycles (stages) before we see any significant microseismic activity, Fig. 2. For these initial stages, the recorded ISIP is less than the ISIP recorded during the original frac. This indicates that the fluid and proppant volumes being pumped are working to overcome the depletion caused by production. Once the ISIP reaches or exceeds the ISIP of new rock, a significant increase in microseismic activity is apparent. Microseismic events recorded beyond this point most likely belong to new fractures being created. The information above is used to create a map of the depleted zones, using the location of microseismic events recorded while the ISIP is less than that of new rock.
To validate this observation, MicroSeismic, Inc. conducted a geomechanical analysis of the refracture, utilizing Istasca’s FLAC3D geotechnical modeling code. A geomechanical model was created to model a hydraulically fractured well with depleted fractures. An implicit discrete fracture network was described in the volume, based on regional knowledge and microseismic observations from nearby wells.
Geomechanical properties and rock failure criteria were established from offset well logs, the world stress map, microseismic focal mechanisms, DFIT and ISIP.
A refracture schedule ran for 50 hr, while pumping at a rate of approximately 60 bpm.
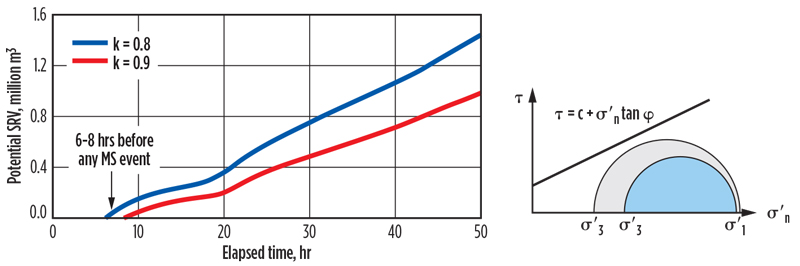
A potential stimulated rock volume (SRV) was estimated, based on the location of rock failure. Figure 3 shows the results of one simulation. In this figure, we compare the impact of refracturing, measured by the potential SRV, for two different stress anisotropy values typical of this formation. The stress anisotropy (k) is defined as the ratio of minimum horizontal stress to maximum horizontal stress. The Mohr’s circle for the two stress anisotropies considered is shown in Fig. 3. The blue circle represents the low-stress anisotropy case, while the grey circle represents the higher-stress anisotropy case. During refracturing, the Mohr’s circle moves toward the left, as the pore pressure in the reservoir increases. Shear failure occurs when the Mohr’s circle touches or intersects the Mohr-Coulomb failure criteria.
The simulation results are very consistent with field observations, and show that it takes several hours of pumping to change the pore pressure and meet the shear failure criteria. The simulation also suggests that it is possible to create new fractures, as shown by the increase in potential SRV.
To accurately determine when new fractures are being created, it is, therefore, important to measure the treatment pressures as well as acquire microseismic data during the treatment. Relying on treatment pressures, alone, can lead to significant errors in the estimation of the incremental SRV from refracturing. This is explored in the next example.
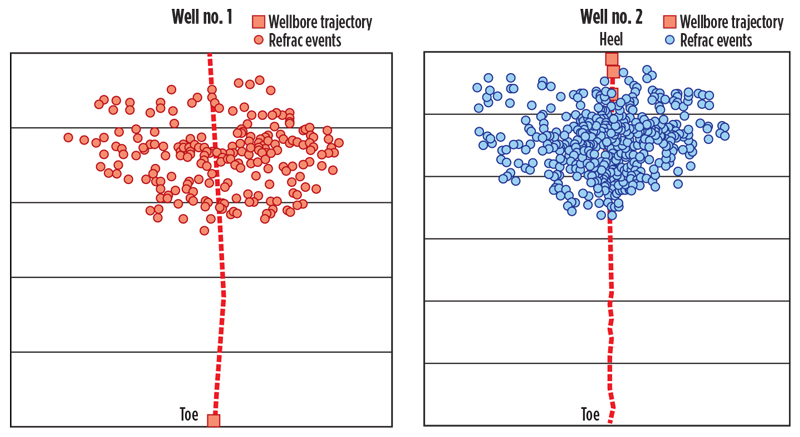
Figure 4 shows microseismic data from two wells that were refraced on the same pad. The initial well, shown in red, was re-stimulated first, followed by the second well, shown in blue. As presented in the previous example, it takes several hours of pumping before there is a significant increase in microseismic activity for the first well. However, there is a higher amount of microseismic activity during the early stages of the second well. The increase in the stress regime, as a result of refracing the first well, results in much higher microseismic activity on the second well. Although not shown in this figure, the ISIP on the early stages of the second well was significantly higher than the ISIP of comparable stages from the first. These observations are consistent with the geomechanical simulation results shown earlier.
While the treatment pressures and ISIP were higher than the ISIP of new rock for a larger part of the treatment, microseismic activity for both wells occurs predominantly toward the heel, and is limited to less than 50% of the physical stages being re-stimulated. Similar results are seen on many refractures that rely solely on diverters to create isolation of stimulated perf clusters. The microseismic results show that diverters provide limited effectiveness in moving the re-stimulation from the heel to the toe. Both wells show a significant increase in treatment pressure, net pressure and ISIP as the treatment progresses. However, using only pressure measurements to determine the success of the refracturing can be misleading, and it is not a reliable method to quantify the effectiveness of the refracture. The better option is to record pressure and microseismic data to enable proper interpretation of results.
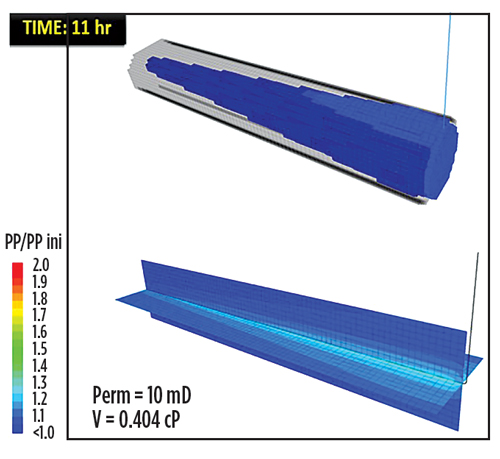
The phenomenon of limiting the new fractures to a portion of the well can also be explained through geomechanical simulation. Figure 5 shows the results of the FLAC3D simulation. The image on top shows the region that has met the shear failure criteria; the image on the bottom shows the net pressure change. These results indicate that the failed region is much larger toward the heel, compared to the failed region toward the toe of the well. Again, the simulation results are very consistent with field observations, suggesting the limited effectiveness of diverters in moving the rock failure toward the toe.
SUMMARY
Based on early success stories, as well as the sheer number of wells that would benefit from refracturing, it is expected that shale well refracturing activity in North America will increase steadily as companies optimize the process. There are, of course, risk factors that need to be taken into account, especially when refracturing older wells that may have completions that have been compromised over time. Also, not every well will respond to refracturing. Understanding the performance, and the critical factors that will ensure success, is key.
To fully optimize the process, data integration within the context of the play and project is essential. Relying on completion data, alone, can misrepresent the incremental stimulated volume achieved from refracturing. Microseismic data and other contextual information, along with rigorous geomechanical simulations, will be critical in accelerating the ability to optimize refracturing.
It’s important to remember that diverter effectiveness can vary significantly between treatments, and coupled with using only pressure measurement to determine success of refracturing, results can be misleading.
Microseismic monitoring provides a direct means of evaluating the effectiveness of refracturing and diverters. Real-time microseismic provides the option for adjusting treatment parameters to increase effectiveness of refracturing; and alternatives, such as mechanical isolation, may provide significant improvements to the overall success of refracturing.
With judicious application and measurement, refracture treatments have the potential to become the secret weapon that allows shale oil producers to compete in this pricing climate. Not only does refracturing potentially produce results that are almost as productive as the original completion, but, because no additional drilling or infrastructure is required, it is significantly more economical. The net effect will be an industry that continues to innovate, with tools that significantly increase the amount of hydrocarbons recovered from shale reservoirs, for less dollars. ![]()
- Shale technology: Bayesian variable pressure decline-curve analysis for shale gas wells (March 2024)
- What's new in production (February 2024)
- Prices and governmental policies combine to stymie Canadian upstream growth (February 2024)
- U.S. operators reduce activity as crude prices plunge (February 2024)
- U.S. producing gas wells increase despite low prices (February 2024)
- U.S. drilling: More of the same expected (February 2024)

