New approaches to inline fluid density and viscosity measurements
Viscosity and density measurements in the oil and gas sector are among the most essential, but also most elusive of operations. From exploration to drilling to production to transportation, the identity and the properties of fluids are the very lifeblood of the industry. Laboratory instruments have only limited application for measuring fluid properties under reservoir conditions. Very high pressures and temperatures, shock and vibration, limited availability of power, and above all, severe space constraints call for novel and creative approaches to measurement of viscosity and density. In this article, we explore both the necessity for inline viscosity and density measurements, as well as describing several new products that enable inline measurements in some of the industry’s most challenging environments.
WHY VISCOSITY MATTERS
When a fluid flows through a pipe, the pressure needed to move it at a given rate depends on its viscosity and the dimensions of the pipe. The higher the viscosity, the more pressure is needed to push the fluid through the pipe. The flowrate is given by Poiseuille’s equation:

where F is the flowrate, R is the radius of the pipe, L is its length, ∆P is the pressure difference between the ends of the pipe, and η is the fluid’s viscosity, Fig. 1.
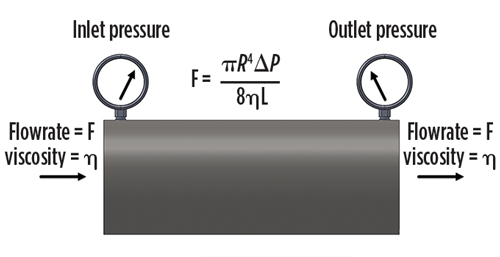
The higher the viscosity, the lower the flowrate. Whether you’re pumping drilling mud, or fracing fluid or crude oil through several kilometers of pipe, small changes in viscosity can have huge consequences for the pressure balance of the system, as well as the power needed to pump the fluid. For instance, to pump heavy crude through a pipeline, pumping pressure can be reduced by controlling its viscosity. Viscosity reduction by heating the oil or diluting it is expensive. To determine how much heat or diluent to add requires measuring the actual viscosity of the thinned crude. By using an inline viscometer and a feedback controller to adjust the temperature or amount of diluent, an optimal balance can be struck between the added cost of viscosity reduction and the desired viscosity of the product.
If the pipe is vertical instead of horizontal, the pull of gravity on the fluid is added to its flow resistance, modifying the pressure drop across the pipe:

where ρ is the fluid’s density, ∆H is the vertical height of the pipe, and g is the acceleration of gravity, Fig. 2.
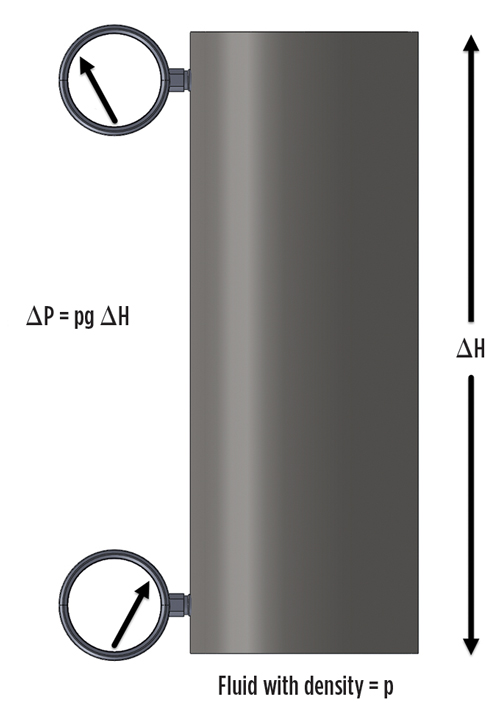
Knowing the fluid’s density is crucial to maintaining pressure balance in a well. And since the actual weight of fluid is used to calculate the value of product, accurate density measurement is an essential factor in custody transfer.
INLINE FLUID PROPERTIES MEASUREMENT
Despite the importance of density and viscosity, they are notoriously difficult to measure under the extreme conditions found in the oil and gas industry. Traditional laboratory methods involve delicate, expensive instruments that can be used only on samples taken from field operations. But an operator trying to control the consistency of mud during a drilling operation needs an immediate, inline measurement to be able to optimize drilling parameters on the fly. A laboratory report delivered hours after the sample was taken is of only limited value, since it reflects the past, rather than actual conditions.
In fracing operations, density is all-important to determining whether the concentration of proppant is on target. An inline density measurement is crucial, because in fracing, things happen fast. Similarly, in cementing, knowing the density of the cement is essential to maintaining a proper pressure balance. Knowing the density of the fluid cement a couple of hours before it sets is of little value to the operator. For making density measurements at high pumping pressures, nuclear absorption instruments are about the only option. But increased cost of compliance and handling of nuclear sources has become a tremendous burden on the industry.
FORMATION FLUID EVALUATION
Evaluation of formation fluid touches the foundation of the industry. Knowing what types of fluids are present, and how they will behave during extraction and transportation, is essential to safe, economical drilling, completion and production. Samples of formation fluid are obtained traditionally by wireline tools. Their collection requires pulling up the drillstring, placing a wireline tool, collecting samples, which are then sent to the laboratory, followed by re-insertion of the drillstring. To preserve the samples’ integrity, it is necessary to maintain them under reservoir conditions of temperature and pressure as they are brought to the surface, a technically challenging and expensive process.
Development of advanced sensor technology and high-temperature electronics makes it practical to include viscosity and density sensors in wireline tools. An example is the Baker Hughes Reservoir Characterization Instrument (RCI) with In-Situ Fluids eXplorer (IFX) service.1 The IFX wireline tool includes a density-viscosity sensor, based on a piezoelectric tuning fork resonator—one of the principle classes of technology that is well-suited to inline density and viscosity monitoring.2 At the same time, Baker Hughes was developing its FASTrak logging while drilling service (LWD) that enabled fluid analysis and sampling during a drilling operation without the need to interrupt it for wireline logging. This system incorporated the piezoelectric viscosity-density measuring system from the IFX tool.3 In 2010, Baker Hughes contacted Rheonics, Inc. (formerly Viscoteers, Inc.) to develop an alternative to the very fragile piezoelectric tuning fork that was used in the FASTrak system. The result was the Rheonics DV-2000, a torsional tuning fork resonator that eventually formed the basis for an extended family of inline density-viscosity sensors that now cover a broad range of applications in the oil and gas sector.
VIBRATIONAL SENSOR DEVELOPMENT
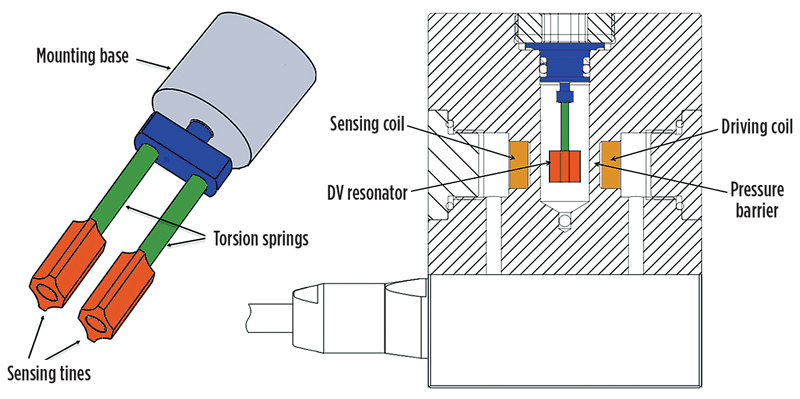
The Rheonics DV-2000 is a vibrational sensor that has its resonant characteristics modified by its interaction with the fluid. The device consists of two coupled torsional resonators that, together, make up a torsional tuning fork, Fig. 3. The resonator is immersed in the fluid under test. The tines contain permanent magnets, which are driven and sensed in torsional vibration by coils that are placed outside of the pressurized fluid chamber that contains the resonator.
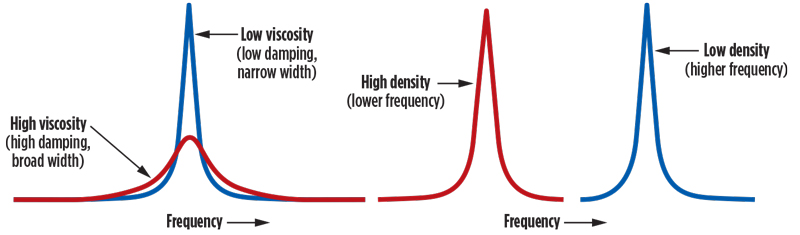
The flattened tines interact with the fluid in two different ways, when they vibrate in torsion. They shear the fluid, which causes transfer of energy from the tines to the fluid through viscous forces. And they displace the fluid, which causes mass loading of the tines proportional to the fluid’s density. When the DV-2000 is driven by a sine wave, its amplitude peaks at its resonant frequency, Fig. 4. The more energy it loses to the fluid through viscous forces, the flatter and broader will be its resonant peak. Similarly, when the resonator is loaded by a dense fluid, its resonant frequency decreases by an amount dependent on the fluid’s density.
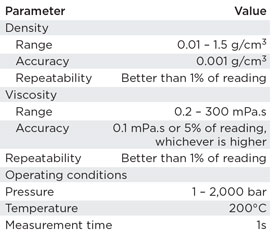
The width of the resonant peak can be used to derive the viscosity of the fluid, and the shift of its resonant frequency can be used to derive the fluid’s density. Together with the Rheonics DVM’s electronics package, the sensor can measure density and viscosity at temperatures up to 500°F, and pressures up to 30,000 psi. Table 1 lists the DV-2000 density and viscosity specifications.
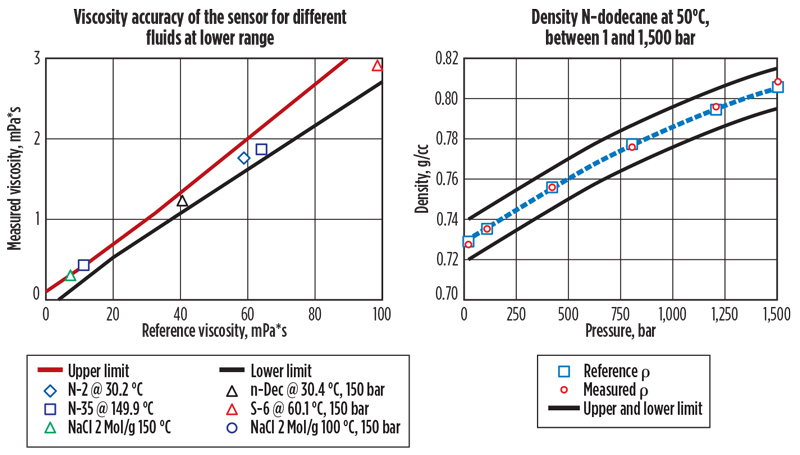
Figure 5 shows the results of tests conducted at a Baker Hughes facility. On the left are viscosity measurements for a series of fluids that cover the specified range of viscosities and densities. Depicted on the right are density measurements. The two lines in each chart show the upper and lower bounds on permissible errors for both measurements.
INLINE DENSITY-VISCOCITY INSTRUMENTS
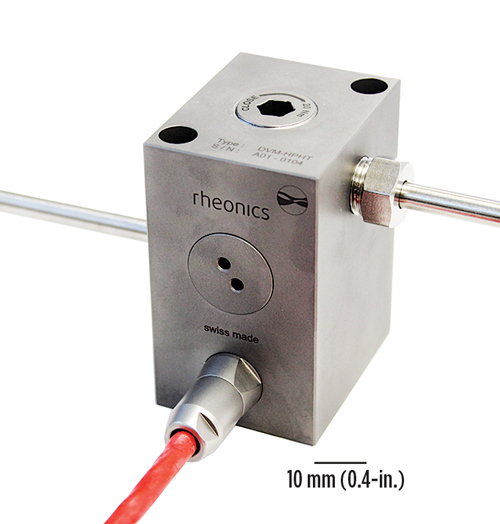
The accuracy, repeatability and robustness of the DV-2000 led to its incorporation in two inline DV instruments more suited to inline and process applications. The Rheonics DVM is a DV-2000 mounted in a titanium block with high-pressure inlet and outlet fittings. Its actual measurement volume is about
0.7 cm3. It operates at pressures up to 30,000 psi and temperatures to 500°F. Its accuracy and range specifications are similar to those of the DV-2000, but its potential exceeds the specs. Principal applications of the Rheonics DVM have been in PVT analysis of live oil samples, in which it is necessary to work with very small quantities of material, while keeping them under reservoir conditions of temperature and pressure. Previous measurements have required separate instruments for measuring density and viscosity, calling for appreciably larger sample volumes, as well as cumbersome fluid transfer systems.
The DVM also has been used for measuring the density and viscosity of both liquid and gaseous CO2 in core-flood experiments, at accuracies that far exceed the target specifications. A second instrument, based on the DVM, is the Rheonics DVP, which was designed as a versatile inline sensor for use in tanks, pipelines and reactors. Its range and accuracy specifications are the same as those for the DVM, but with a lower pressure rating of 10,000 psi. The DVP is geared toward applications involving multi-station monitoring of fluids in pipelines, viscosity-based pump optimization, custody transfer, and high-pressure inline density monitoring. The DVP is one of the only non-nuclear instruments capable of accurate inline density measurements in the 10,000-psi range. As such, new application areas are now available that were covered previously by indirect methods, such as ultrasound transmission or differential pressure measurements across a vertical column of fluid.
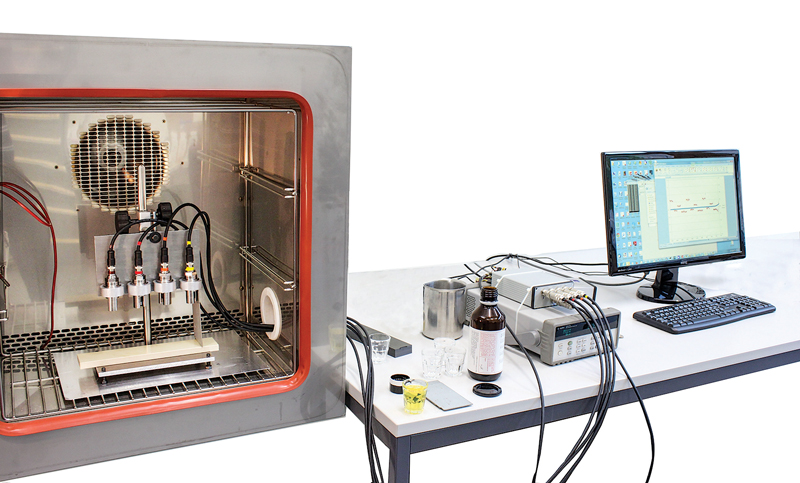
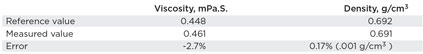
The Rheonics DVM is well-suited to measuring properties of live oil samples, because of its small sample volume, its wide range of viscosity measurement without interrupting a measurement run to re-configure the hardware, and its ability to measure density and viscosity simultaneously on the same sample, Fig. 6. Because competing systems use two separate instruments to measure density and viscosity, they require a larger sample volume and cause complications in the transfer of live oil samples. The Rheonics DVM is installed in a live oil specimen tank, inside an oven. Its compact size and simplicity of connection allow it to be mounted directly on the live oil sample container.4 A trial run of heptane at 46.8°C and 341 bar pressure yielded values listed in Table 2, compared with standard reference values.
INFERRING RHEOLOGICAL PROPERTIES
Advanced EOR techniques use a system in which two immiscible fluids are emulsified. Foam EOR involves generation of surfactant-stabilized gas-water emulsions in the reservoir, to control the mobility of the low viscosity of displacing gas (N2, light hydrocarbons, CO2, etc.) and thus, increase sweep efficiency. In chemical EOR methods, such as ASP (alkali surfactant polymer) flooding, the oil recovery process is governed by surfactant-induced formation of a microemulsion of oil and water, which is then chased with a polymer-induced viscous brine flooding. Both methods seek to optimize the rheological properties at reservoir conditions with minimal chemical addition. It may take days to months for a laboratory characterization of a formulation’s rheological behavior in reservoir conditions, making quick screening of formulations quite challenging. The most important and least controllable factors are the properties of the porous medium. These properties may change during the experiment, making direct measurement of rheological properties almost impossible.
The Rheonics DVM can measure simultaneously the density and viscosity of such chemical formulations at reservoir conditions in a few hours, making the rate-limiting step the time scale of the chemical interactions in the process. The DVM instrument is being used in core-flooding apparatus to accelerate product development through accurate rheological measurements at reservoir conditions.
The ability to measure density and viscosity simultaneously also provides essential information about the texture of the emulsion. A uniform measured density and stable viscosity indicate a stable emulsion with homogeneously dispersed phases.
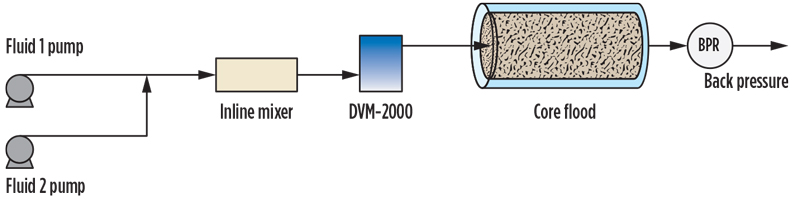
On the other hand, if the texture is inhomogeneous, as in slug flow, this is shown qualitatively by strong fluctuation of the indicated density and viscosity. Such information is quintessential to the design and implementation of EOR methods. A schematic of a typical flow-through set-up using the Rheonics DVM unit, is shown in Fig. 7, where two immiscible fluids (one of which is typically a surfactant formulation in brine) are pumped simultaneously through an inline mixer, DVM monitoring system and a core-flooding system in series.
INLINE MEASUREMENT OUTLOOK
Resonant fluid properties sensors are pushing back the limits of measurements thought to be possible only with laboratory-grade instruments. Beyond applications mentioned above, these sensors also have been used to measure deposition of waxes and asphaltenes. The basic inline sensing technology can be optimized to measure not only deposition, but also corrosion in real time, permitting targeted dosing of chemical treatments under field conditions.
A third Rheonics sensor, the SRV, is capable of measuring viscosity over a very wide range, from less than 1 cP up to 50,000 cP. It is a highly stable process control instrument for use in manufacturing and dosing operations, even with dispersions, slurries and other atypical fluids. It is being used to accurately control the viscosity of a non-Newtonian slurry in a high-value coating application. It also can be used to monitor and control the viscosity of fluids in pipes and pipelines, including bunker oil burner systems for marine engines, and pipeline transport of heated or diluted heavy crude oil. ![]()
REFERENCES
- http://www.bakerhughes.com/products-and-services/evaluation/openhole-wireline-services/fluid-characterization-and-testing/in-situ-fluids-explorer-ifx-service
- http://assets.cmp.bh.mxmcloud.com/system/2b28ed6ee779a9285b77474a0e18e449_30632_rci_in_situ_fluids_explorer_po_hq.pdf
- Goodbread, J., B. Ochoa and T. Kruspe, “A new sensor for viscosity and fluid density measurement for oil well drilling applications,” Proceedings of ITG/GMA Symposium, 2014, pp 1-6.
- DVM measurement data courtesy of Stratos Geroulis, AsphWax, Inc.
- Coiled tubing drilling’s role in the energy transition (March 2024)
- Advancing offshore decarbonization through electrification of FPSOs (March 2024)
- What's new in production (February 2024)
- Subsea technology- Corrosion monitoring: From failure to success (February 2024)
- Digital tool kit enhances real-time decision-making to improve drilling efficiency and performance (February 2024)
- E&P outside the U.S. maintains a disciplined pace (February 2024)

