An unplanned release event is highly undesirable and can lead to large-scale disasters in worker safety, environmental considerations and economics. Comprehensive risk assessment of the operation is, therefore, a critical step for well development. Emergency response plans can then be formulated to meet any challenges highlighted. Highly detailed plans can be developed up front, which can be put into action immediately, should an unplanned event occur. Such emergency response plans are now regulatory requirements in some locations.1
These unplanned events can be studied and prepared for, using modern analytical tools. In the event of an emergency, pre-engineered simulation models can save valuable time. If the models have been created already, inputs can be modified to match live and changing data—work can start immediately on understanding the event and getting it under control. Preparations can be made for every stage of the emergency response. Fluid dynamics models can be used to understand the blowout, itself, and release behavior. Installation analysis software can be used to assess capping stack deployment suitability.
Automated design processes can reduce load-out project timelines, when it’s most required. Tools are also available that can be used to assess the sustainability of a capping device in the aftermath of a blowout, considering issues such as additional loading on the wellhead and conductor from a capping stack; stress distributions; erosion levels; and flow assurance through the capping stack. Each of these tools can give valuable insight to an event and highlight any immediate requirement for a secondary control strategy.
The techniques used to model the subsea spread of hydrocarbons and atmospheric dispersion of gas are the main focus of this article—these factors determine the exclusion zone. A range of potential risks, due to gas migration, has to be considered in the event of a blowout. As gases reach the sea surface, there is a potential risk to the stability of the floating vessels, due to loss of buoyancy, or due to the radial outflow of water that has been entrained in the plume.
Hydrocarbons reaching the sea surface have the potential to adversely affect the environment, and they also can pose a threat to offshore personnel and structures. As soon as the gas enters the atmosphere, the presence of oxygen brings a risk of explosion and pool fires. Additionally, if the release contains hydrogen sulfide or, indeed, any toxic component, the risk to the health of workers needs to be considered.
A multi-physics modeling approach is presented in this article, which uses different modeling techniques for different stages of the hydrocarbon migration. The most suitable technology, which captures the relevant physics, is applied to each stage. A technique for numerical analysis through the water column is presented. A comparison between two commonly accepted industry methods for the atmospheric dispersion is then made.
THEORY
CFD theory. Computational fluid dynamics (CFD) is a numerical analysis tool used to model fluid phenomena by solving the governing mathematical equations, using iterative techniques. Mathematical models applicable to the case under consideration are selected to represent all physics, with the potential to influence the result. These physics models are, in general, a simplification of the phenomenon’s governing equations, which allow the underlying physics to be represented to a good level of accuracy without unreasonable computational expense.
As more models are selected, the computational expense of the simulation is increased, making it imperative that the correct physics are selected at the outset. A computational domain can then be discretized into a number of control volumes, on which a bounded fluid flow is solved. This is done in an iterative approach, until conservation of matter, momentum and energy is achieved to a sufficient level. At this point, the quantities of interest can be extracted; for example, temperature, pressure and volume fraction of the fluid at a
specific point.
Gaussian theory. Many tools have been developed that allow plume dispersion to be predicted with the use of a Gaussian technique. In this approach, the user inputs a release source, and the subsequent dispersion levels are calculated, using a normal distribution probability about the plume centerline. An advantage of the Gaussian technique is that software tools specifically designed for the process have inputs for Pasquill-Gifford stability classes, which refer to the inherent instability gradients found in the atmosphere.
Conditions are rated at stability levels from A to F, based on conditions found at the location. This rating is part of the normal distribution calculation, which determines the plume spread and dilution with the atmosphere. This stability classification is difficult to replicate with the use of classical turbulence models found in numerical analysis; modified versions are required.
Atmospheric dispersion. Software to simulate atmospheric dispersion includes CFD and specifically designed, Gaussian atmospheric dispersion software. CFD offers advantages, in that the user has complete flexibility in setting up the geometry of the release on the sea surface, and results are obtained three-dimensionally from a solution of the Navier-Stokes equations.
However, there are considerable complexities involved with accurately predicting the turbulence field and subsequently establishing concentration fluctuations. The inclusion of atmospheric stability effects poses further challenges. Solving the Navier-Stokes equations necessitates extended run times on the computer system. Gaussian dispersion calculations can be performed at a fraction of the time of a CFD analysis, allowing large screening studies to be carried out.
However, a limitation of the Gaussian approach is that a single source rate is specified at a constant value. In the case of atmospheric dispersion from a subsea plume, concentrations will, in reality, diminish as the location moves away from the central nuclei of the gas surface break-out. It should also be noted that in the Gaussian approach, no detailed surface topology is considered. Numerical analysis may be more suitable, if there is significant geometry present, which causes aerodynamic disturbances, as the normal distribution approach assumes a constant wind profile.
A subsea blowout is a complex event that can occur over extended distances. In deepwater drilling, the vertical distance from the release point to the sea surface can exceed 1 km. Over this distance, the escaping gas will experience PVT changes, be subjected to hydrodynamic loads and undergo complex effects, such as bubble break-up and coalescence. Advances in computational analysis now allow models to be selected, which can capture all the effects of the gas migration through the water column and into the atmosphere.
In typical computational fluid dynamics (CFD) modeling, high-resolution, near-field grids are used to solve algebraic representations of the governing Navier Stokes equations. However, in this case, making a single, all-encompassing computational analysis is difficult, due to the disproportionate scale in the overriding physics at each change in the hydrocarbons migration. Grid refinement and physics selection to capture the jet effect as the plume exits, for example, is different to the physics selection and grid settings required for the above-surface dispersion. It is, therefore, applicable to bound the problem in three distinct regions: Immediate release (zone 1); water column dispersion (zone 2); and atmospheric dispersion (zone 3), as shown in Fig. 1.
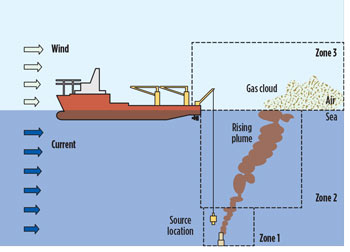 |
| Fig. 1. Dispersion analysis bounded into three zones. |
|
TECHNICAL APPROACH
Zone 2. A 3D, multi-phase, CFD analysis technique has been used to predict the plume dispersion, as it is released from a subsea location. A schematic of the subsea model setup is shown in Fig. 2. The simulation domain is modeled as a rectangular box, with sufficient distance to accommodate the formation of a fully developed flow upstream, and allow the subsea plume to rise to the sea surface, downstream from the release location. The release location depth, and the release diameter, were set to arbitrary, typical, release point conditions.
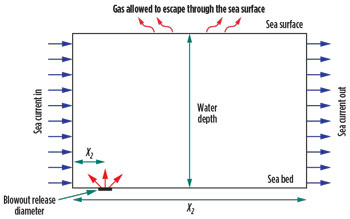 |
| Fig. 2. Schematic of CFD model for subsea, Zone 2 analysis. |
|
In the analysis, seawater was set as the primary phase, and the secondary phase was modelled as a gas (it can also be set as oil or a combination of both). The simulation of the hydrocarbon (oil and gas) dispersion in seawater was carried out, using a Eulerian-Eulerian multiphase approach. The use of this multiphase model allows the plume analysis to consider dispersion for the full water depth, while taking into account the effect of sea current and gas expansion.
The fate of the bubbles, as they are rising through the water column, is decided by the drag they experience. Bubbles with a higher drag and associated turbulence levels are broken up, into smaller bubbles. Bubbles that come together experience coalescence and combine into larger single entities. It is expected that these larger bubbles will have a tendency to follow a relatively vertical trajectory, as compared to smaller bubbles. For the modeling, this means that smaller bubbles are carried further by the current and break-out of the sea surface further downstream from the release, as compared to bigger bubbles that have a more direct ascent to the sea surface.
In the modeling approach, a population balance model was employed in the CFD analysis, to model the bubble break-up and coalescence. Drag, turbulent interactions and surface tension experienced by the bubbles, as they rise up the water column, are accounted for by a range of sizes, with the minimum and maximum bubble size set by the user. For this case, the formation of hydrates, and dissolution, were not simulated. This is considered conservative, as their formation and transport would reduce buoyancy and delay the plume rise.
Zone 3. Gas dispersion from a subsea release presents unique challenges for analysis. Firstly the nature of dispersion within Zone 2 means that the gas enters Zone 3 over a wide area. Additionally the gas release rate is non-uniform; with rapid release near the Zone 2 breakout points and a diminishing release rate with increasing distance from this. If the current is strong or depth is great the release is seen to split into two distinct foci. The momentum of the release is considered a minor effect due to the wide area of the release. Wind speed is a critical parameter of the gas dispersion, with worst case scenarios generally occurring under light wind conditions. Likewise wind direction is an important consideration, particularly if vessels are attempting to deploy a capping stack on the well. Under this scenario a wind direction in the opposing direction to the current is particularly problematic as the gas release is blown back over the wellhead. Other considerations include atmospheric stability and the buoyancy of the release. To add conservatism a safety margin is applied. Typically the 10% LEL is treated as the point below which no credible explosion risk remains. A distinction must be made between time-averaged concentrations and the instantaneous peaks of concentration, due to turbulent fluctuations.
RESULTS
Zone 2. Figure 3 shows the velocity profile at three heights above the release point. The CFD model allows a range of factors to be presented, such as volume fraction, which allows for the establishment of an exclusion zone. There is little experimental data available with which to compare these results. However, this work has been compared with the results of a small scale test.2 While the CFD results do not exactly match the experimental results, as is to be expected, factors of safety have been applied to these models, which result in a conservative result that can be produced in a useful time frame for emergency response.
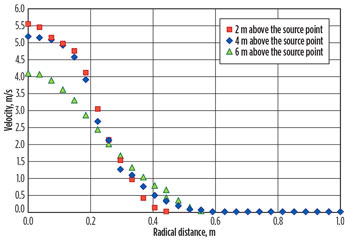 |
| Fig. 3. CFD model for subsea, showing the velocity profiles, Zone 2 analysis. |
|
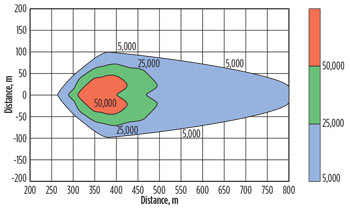
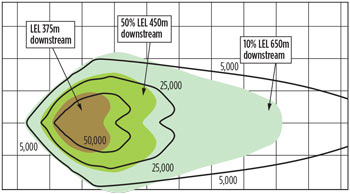
Zone 3. Figure 4 shows a time-averaged result from a CFD prediction of a surface release. Due to the large release area and strong wind simulated, the plume is dispersed along the surface with no lift-off, due to buoyancy. Figure 5 shows the corresponding result, using atmospheric dispersion. Note that this comparison can only be drawn if using software that permits the inclusion of a non-uniform surface release. Finally, Fig. 6 shows the superimposed results for comparison.
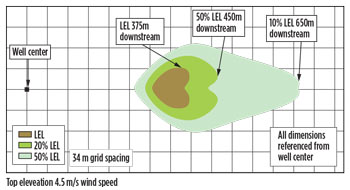 |
| Fig. 4. Plan view of gas dispersion envelope, using CFD. |
|
 |
| Fig. 5. Plan view of gas envelope, using Gaussian dispersion. |
|
 |
| Fig. 6. Superimposed contours from CFD and atmospheric modeling. |
|
CONCLUSIONS
For the subsea dispersion in Zone 2, a practical approach has been presented that allows solution of the complex subsea dispersion problem in a suitable time frame. To fully assess the approach, more validation work against test data is required. Wild Well Control is involved in a Joint Industry Project, aimed at generating more experimental data. Prospect is also developing the Zone 2 model, to reduce the conservatism from the current predictions.
In the atmospheric dispersion, Zone 3, the CFD result shows a shorter profile, indicating a more rapid dispersion of the gas into the atmosphere. Generally, it is expected that CFD turbulence models would, in fact, give a longer dispersion profile, due to the known limitation with far-field turbulence, and atmospheric stability limitations with standard numerical turbulence models. In this case, however, it should be noted that the models are not identical in terms of treatment of surface roughness. The Gaussian prediction uses a smooth surface for the sea, whereas the CFD uses the Charnock relation. This, in turn, means the CFD has a higher turbulence rate, mixing the flow with the atmosphere and aiding dispersion. This and other comparative studies demonstrate the need for conservatism in the interpretation of results, whichever software product is used for Zone 3 analysis.
The methods presented here provide a useful assessment/prediction of the safe exclusion zone around a subsea hydrocarbon release event. These analyses represent an important input to and output from an emergency response plan. 
ACKNOWLEDGEMENT
The authors would like to thank additional members of the Wild Well Advanced Engineering Team for their contributions: John Bryan, John Eddie and Kevin Wilson.
REFERENCES
- NORSOK STANDARD Z-013, “Risk and emergency preparedness assessment,” Edition 3, October 2010.
- Engebretsen, T., “Surface flow and gas dispersion from a subsea release of natural gas,” Proceedings of the Seventh International Offshore and Polar Engineering Conference, ISBN 1.880653-28-1, 1997
|


