Lies, damn lies, and commodity forecasting!
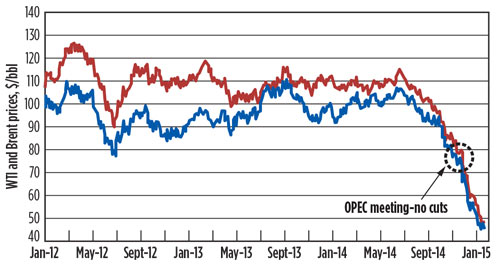
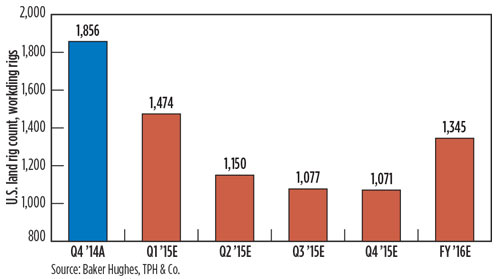
Global oil prices have fallen more than 50% since mid-2014, Saudi Arabia is sitting on the sidelines, and global demand remains the monster in the closet. OPEC’s Thanksgiving Day “commodity massacre” set the stage for another leg down in oil prices, when the organization opted to make no change to current production targets, nor did they set plans for an extraordinary meeting in February. Essentially, OPEC said “See you in June,” which gave neither support nor leadership to an increasingly oversupplied market, Fig. 1.
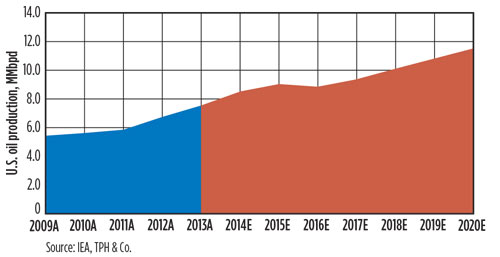
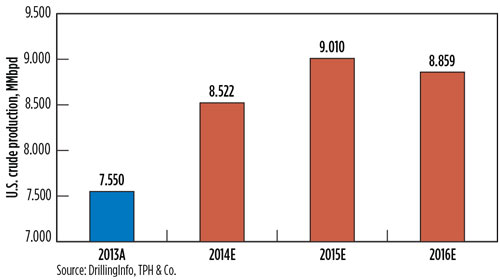
The current oil market oversupply was driven by slowing demand growth, combined with ongoing significant supply growth, driven by the big ramp in U.S. onshore production, Fig. 2.
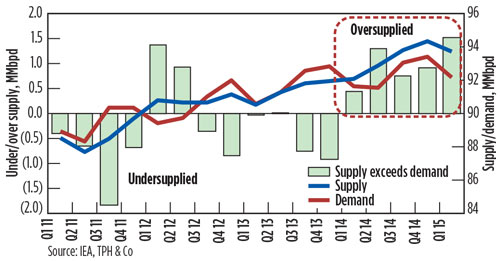
But wait, there’s more. The challenge in an oversupplied commodity market is that it takes time for fundamentals to change in response to a price signal, Fig. 3. Make no mistake—cutting oil prices in half is a strong signal to producers, but unless prices are so low that production gets shut-in, a supply response takes months to materialize. While supply levels sort themselves out, inventories build, and the downward pressure on prices intensifies.
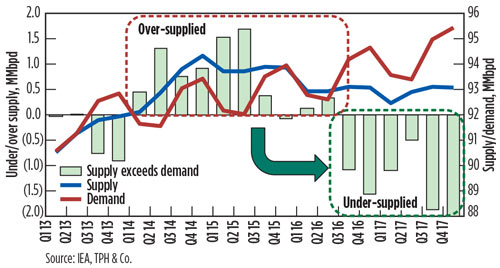
Figure 4 shows that the supply-and-demand outlook worsens for the next two quarters before it improves later this year. Expect first-half 2015 inventory builds to be significant, until the impact of today’s low prices starts to impact U.S. production growth.
How do we get from a market that is oversupplied, to one that is undersupplied in 2016? Non-OPEC supply transitions from 1.0-plus-MMbopd growth to declines by 2016, led by both the U.S. and Russia. Although we expect global demand growth may move higher than last year’s 600,000 bopd, on the back of the stimulating effects of low refined product prices, our current model only assumes a similar, modest 0.6% average global growth rate. If a re-acceleration of growth occurs back to, say, 2013 levels of 1.2-MMbopd growth, global markets could tighten quickly.
How does supply correct itself in 2016? Low oil prices are creating an environment, where many individual wells are not economic to drill, while stretched company balance sheets require spending within current-year cash flows. Forced, rapid activity reductions are the result. Although forecasting drilling activity in this dynamic environment is difficult, we believe that in any reasonable scenario, U.S. land drilling activity (Fig. 5) will be cut sufficiently to slow 2015 U.S. production growth, and move the trajectory to declines by 2016, Fig. 6.
Other considerations. Global demand is more challenging to forecast than global supply growth. Our base-case assumes global demand growth muddles though with an eye toward re-acceleration. However, the recovery will be pushed into 2017, and further, if global demand contracts and OPEC inaction mean that non-OPEC declines are the sole driver to balance the market.
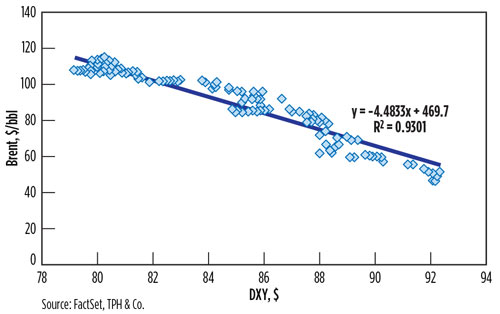
Low oil prices have spurred more discussion of global deflation. This has caused more stimulus discussion in Europe, and a stronger U.S. dollar. The strong dollar puts downward pressure on crude oil prices—this was true in 2008 and 2009, as well. So, if you want to be a commodity forecaster (and get it right to the $1/bbl), you need to be able to forecast currency movements.
While Fig. 7 highlights the strong relationship between the crude price and U.S. dollar strength (r=93%), we are comforted by the limited magnitude of the relationship (y=4.5x). Only about 20% of the recent change in crude is explained by the change in dollar strength.
SLOWING GAS GROWTH ALLOWS DEMAND TO CATCH UP
Current natural gas supply-and-demand fundamentals are just awful. Today’s market is literally swimming in gas, and that is reflected in current prices around $3/MMBtu—in the middle of winter’s seasonally high demand.
However, we expect significant improvement just over the horizon. The lifting of the dark cloud will not come in the next couple of months, but by the second half of this year, we expect to see a few rays of sunshine. The driver will be the confluence of a slowing production ramp, and respectable 2015 demand growth, which moves our expected market clearing price, from $3/MMBtu levels to $4/MMBtu by year-end 2015, and through 2016.
We have become increasing bullish for 2016 gas fundamentals in the last three months. While our expectation for more than 2 Bcfd, or 2.5% of year-over-year demand growth, has remained largely unchanged, our view of supply growth has seen recent, material downward revisions.
The slowing associated gas production is the primary driver of our more positive view. A knock-on effect of our expected decrease in U.S. oil production is less natural gas output. Less oil production means less natural gas supply associated with that output. Versus our prior November 2014 expectations, we see 2 Bcfd less gas supplied into the 2016 market.
Marcellus production. Northeastern natural gas drilling activity will likely slow year-over-year, on a combination of low natural gas prices, wide regional price spreads and low NGL pricing. While we continue to forecast gas production growth out of Marcellus and Utica producers, our 2016 growth expectation is materially lower than mid-2014 predictions.
Natural gas prices averaged nearly $4.40/MMBtu in 2014. However, Marcellus-area prices averaged $1/MMBtu less, as local supply started to overwhelm local demand. More striking, however, is the January 2015 price spread of $1.75/MMBtu. This is scary stuff for northeastern U.S. producers without sufficient, firm, pipeline transport contracts to take gas out of the basin to higher price markets. New pipeline capacity will fix this extreme price dislocation, but this is the world that northeastern U.S. producers are living in today.
Low NGL prices undermine the economics of drilling a wet gas well. Wet gas Marcellus producers have been able to ignore poor, local, natural gas prices in a $100/bbl oil world, given the prices that the liquids portion of their production fetched. In a sub-$50/bbl world, NGL revenues are no longer a crutch and will bring a period of low gas prices.
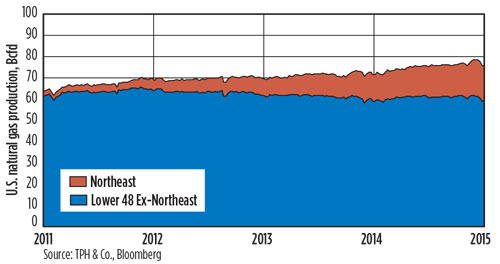
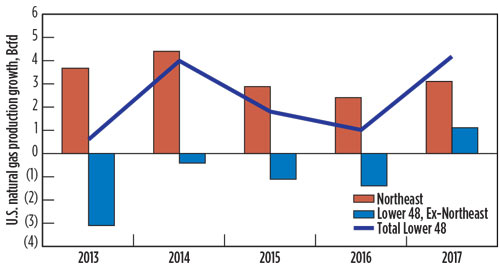
While current Northeastern gas production accounts for a bit more than 20% of total U.S. production, the region is responsible for all supply growth in recent years, Fig. 8. Overall gas supply growth dips to 1.0 Bcfd by 2016, as a forecasted slowing of Marcellus-area growth augments accelerating 2015-to-2016 declines in the balance of the U.S. (associated gas), Fig. 9. ![]()
- The last barrel (February 2024)
- E&P outside the U.S. maintains a disciplined pace (February 2024)
- International drilling and production: Growth outside the U.S. continues at measured pace (February 2023)
- U.S. reserves: U.S. proved reserves experience significant increase (February 2023)
- U.S drilling: U.S drilling activity to climb as supply disruption continues (February 2023)
- Canadian E&P: Canada’s upstream on track to strengthen during 2023 (February 2023)
- Applying ultra-deep LWD resistivity technology successfully in a SAGD operation (May 2019)
- Adoption of wireless intelligent completions advances (May 2019)
- Majors double down as takeaway crunch eases (April 2019)
- What’s new in well logging and formation evaluation (April 2019)
- Qualification of a 20,000-psi subsea BOP: A collaborative approach (February 2019)
- ConocoPhillips’ Greg Leveille sees rapid trajectory of technical advancement continuing (February 2019)

