NETL develops advanced CO2 foam reservoir simulator
A new equation-of–state simulator was developed by the U.S. Department of Energy.
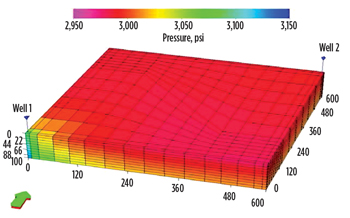
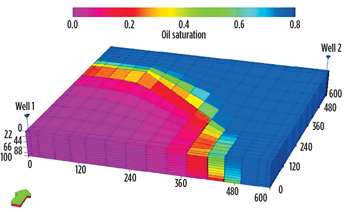
Reservoir simulation development has, historically, been a very active area of R&D at the U.S. Department of Energy (DOE). Research projects for the development of simulators possessing the capability to investigate the effects of chemical, thermal and miscible processes were awarded as early as 1980. Specifically, the development of simulators modeling CO2 enhanced oil recovery (EOR) has been targeted, due to the amount of additional oil that can be recovered.This article presents novel, physical approaches in modeling the CO2 foam processes and phase behavior improvements to previous UTCOMP models, as well as coupling a poroelastical model to account for geomechanical events. Improvements in numerical aspects of modeling and computational efficiency are also presented. Since post-processing and visualization of simulation results is becoming increasingly important in presenting results, a new version of S3GRAF was provided to support well data and 3D grid results. BACKGROUNDThe DOE’s Office of Fossil Energy has supported a large number of theoretical, laboratory and field studies, in an effort to improve oil recovery processes. A majority of the projects were related to advanced reservoir characterization and simulation, mobility control, and conformance of CO2 flooding. In September 2010, the National Energy Technology Laboratory (NETL), a part of the DOE, awarded a number of new research projects to further development of the next generation of CO2 EOR.1 One of the objectives, of the funding announcement, was to advance simulation and visualization tools, processes, algorithms, and related techniques, to ready them for implementation into commercial simulators, or as stand-alone tools, processes, algorithms and related techniques that can be used to enhance production and minimize environmental impacts associated with the development of unconventional domestic resources. These simulation and visualization tools were intended to improve the design and operation of advanced CO2-EOR technologies at the reservoir scale, enhance field characterization, and improve understanding of the application of next-generation CO2-EOR technologies. Funding this type of research came as a result of a revised national resource assessment for CO2 EOR, conducted by NETL. This research indicated that “next generation” CO2 EOR can provide 137 Bbbl of additional, technically recoverable U.S. oil, with about half (67 Bbbl) economically recoverable at an oil price of $85/bbl. As a result, The University of Texas at Austin (UT) was awarded a project. Its objective is to develop an advanced reservoir simulation and visualization tool, for compositional flow and transport, coupled with geomechanical deformation in porous media, with advanced mobility control methods, such as foam, to better model and predict oil production during CO2 flooding.2 SIMULATOR DEVELOPMENT PHYSICSIn the design and optimization of a CO2 EOR process, a reservoir simulator is an essential and necessary tool for field operators, especially when they try to control mobility and conformance using foams to increase the volumetric sweep efficiency of CO2 flooding. The developed simulator, referred to as “UT-DOECO2,” is an advanced version of UTCOMP, developed at UT, with unique scientific and computational features.3 These features include a foam module; a new compositional, three-phase relative permeability module with hysteresis option; a three-phase hydrocarbon phase behavior module; a geomechanics module; a corner point grid; visualization; and efficient methods to solve the pressure equation. The UT-DOECO2 reservoir simulator can simulate various recovery processes, such as primary, secondary waterflooding, and miscible and immiscible gas flooding. It includes several mobility control options, including foam flooding. Foam module. The newer versions of UTCOMP simulators already had foam models, either based on a critical capillary pressure (P*c) and/or using table look-up for residual resistance factor. In the UT-DOECO2 simulator, a third option was included for foam by using the local-equilibrium (LE) approximation method of population balance modeling. The dynamics of lamellae generation and coalescence were explicitly modeled in the population balance models whereas, in the LE model, the foam texture is approximated by placing foam-generation and coalescence rates in equilibrium.4 This foam-texture approximation increases the applicability of population balance models for full-field, 3D studies. The model was validated and implemented in the simulator by comparing the simulation results with several published coreflood results.5 For CO2 foam EOR modeling in the UTDOE-CO2 simulator, mathematical foam models were derived. They consist of a system of partial differential equations and supplementary algebraic equations. A fully coupled formulation of the two-phase foam system, using LE approximation based on population balance, and a table look-up approach modeling of the fully coupled fluid flow and mass transport equations, was considered adequate. In contrast to other formulations, this leads to a more robust approach. Phase Behavior Module. The PVT (pressure-volume-temperature) relationships in the UT-DOECO2 simulator are calculated, using equations of state (EOS). Up to four phases have been considered: a CO2-rich phase (labeled as a gas phase); a H2O-rich phase (labeled as an aqueous phase or water phase); a hydrocarbon phase (labeled as an oil phase); and a second, non-aqueous phase. A modified Redlich-Kwong (MRK) equation of state (EOS) (and/or Peng-Robinson, abbreviated as PR EOS) is used to calculate the density of the gas phase. The hydrocarbon viscosity is calculated from three options of Lohrenz, et al,6 a quarter-power mixing rule, or linear mixing rule. For the brine density, the user first specifies the density of pure water, and then the code corrects it for salt and CO2 effects. The viscosity of the aqueous phase also can be computed from a summation of pure water viscosity and non-water component coefficients, applying an empirically linear rule. The two-phase foam system under consideration can be extended to incorporate mass fractions, which allow for mutual dissolution processes. In fact, a three-phase, flash cubic EOS is used to allow for mutual solubilities of water, oil and gas in all three phases. This means that we are able to obtain mutual solubilities of CO2 (as a tracer) in water (xCO2) and water-in-gas phase (yH2O), matching experimental data for CO2-H2O systems under typical conditions. They are calculated following the procedure given by Whitson and Brule,7 and based on fugacity equilibration between water and gas phases. Water fugacity was calculated, using Henry’s law; CO2 fugacity was calculated using the PR EOS. Solubility of water in the hydrocarbon phase was ignored. Physical property module. Three-phase fluid flow in porous media models needs two main parameters that appear in the governing flow equations: three-phase relative permeability and three-phase capillary pressure. Three-phase relative permeability is a function of rock and fluid properties: rock wettability, pore structure, saturation of two phases, saturation history, saturation trajectory, trapping number, and phase compositions. Based on the definition of two-phase relative permeability in the Jerauld’s model, a generalized, three-phase, relative permeability model (UTKR3P) was proposed and implemented.8 It is a continuous function of phase saturation and the phase molar Gibbs free energy (the Gibbs free energy of one mole of atoms). The relative permeability of each phase is calculated, based on the phase referenced to relative permeability parameters and the phase referenced to Gibbs free energy. This approach reduces the cost of computation and avoids the phase flipping problems that cause numerical convergence issues. Three-phase capillary pressure is calculated, based on measured two-phase data. A new model—incorporating primary, secondary, and scanning saturation histories—has been implemented. The key features of this model are consistency, compatibility, symmetry, simplicity and flexibility. The three-phase capillary pressure parameters for each phase are interpolated between their reference values for each phase and for each process, i.e. drainage and imbibition, based on that phase Gibbs free energy. Three-phase residual saturation is a crucial parameter in three-phase flow modeling. In general, two-phase and three-phase residual saturations are not unique. The residual saturation of a specified phase can decrease, increase, or remain unchanged, due to different parameters: the phase(s) saturation, the saturation history, the saturation trajectory, the interfacial tension or capillary forces, the viscous forces, gravitational forces, and the phase composition. A new three-phase, residual saturation correlation, accounting for the above parameters, was implemented. Relative permeability and capillary pressure functions depend on saturation history, so four different hysteresis models were implemented for accurate modeling of the processes, in which the phase saturation direction and saturation path change. These include Carlson’s two-phase hysteresis model; Fayers’ and Matthews’ oil hysteresis model; Larsen’s and Skauge’s three-phase hysteresis model; and UT’s new three-phase hysteresis model, UTHYST.9 Geomechanics. A module that allows assessment of a reservoir’s geomechanical behavior was built in the simulator. Reservoir deformation, surface subsidence, well stability, sand production, and hydraulic fracturing produce a solid-phase mechanical response that modifies fluid flow. Therefore, coupling the fluid flow equation with porous media deformation was addressed. Isothermal condition for the coupled fluid-solid system, and no chemical reactions between fluid components and solid medium, were considered.10 A compositional flow model, in the coupled compositional flow and linear poroelasticity model, was then derived. NUMERICAL MODELDiscretization. In addition to the Cartesian grid system, a corner point mesh was developed and implemented. The equations describing the physical model were transformed from a Cartesian system to a computational domain. Then, the transformed equations were integrated into the regular system. Finally, the material balance equation of each component was modified. Figure 1 shows the pressure distribution after 200 days of waterflooding, using corner point mesh. The corresponding oil saturation map is shown in Fig. 2. The visualization software, S3graf, now supports the corner point grid option.
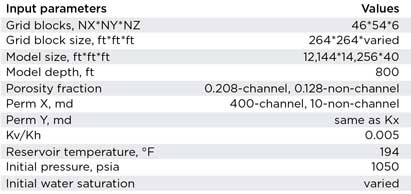
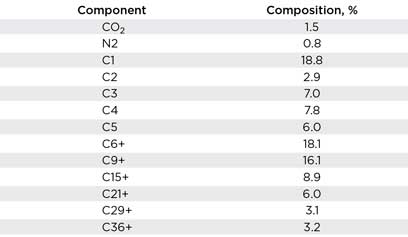
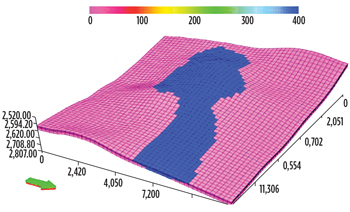
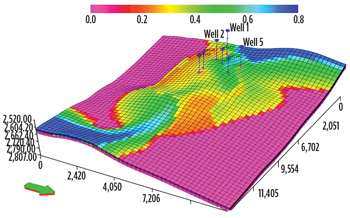
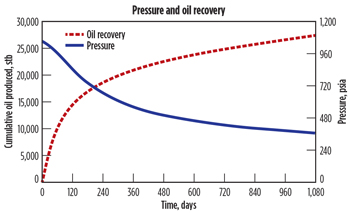
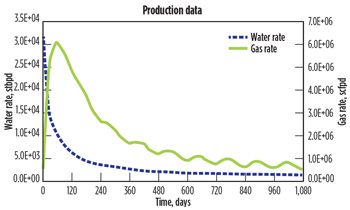
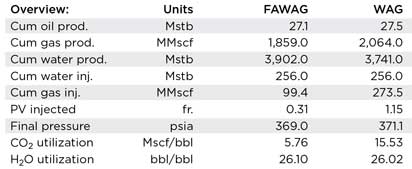
Well module. The horizontal and deviated well options, using the Peaceman well model, were implemented to allow for either vertical or horizontal well representations. This module relates the controlled variables—such as flowrate and BHP—to the reservoir and fluid properties. Different well constraints—such as constant total flowrate, oil rate, and constant flowing BHP—are available. Computational efficiency. The default solver is the direct-banded Gaussian elimination scheme. Other solvers, such as iterative solvers using different combinations of pre-conditioners and solution methods, were also implemented. Post-processing and visualization of the simulation results are provided with S3GRAF to support both well data and 3D grid results. The binary format required for S3GRAF, to upload the output files efficiently, was implemented. A new version of S3GRAF, compatible with corner point grid, was recently completed by Sciencesoft Ltd. CASE STUDYA 3D, field-scale, water alternating gas (WAG) injection process has been modeled. This study was initially performed by Pudugramam.11 The input file was then modified and run with the latest version of UT-DOE-CO2. Field L is based on a mature U.S. field with a 50-year history of primary production and waterflooding. It is under a feasibility study for a CO2 flooding, with foam as the mobility control mechanism. The reservoir lithology is sandstone, with a thickness of 40 ft. The area under consideration has a channel and a non-channel area. The permeability of the channel is 400 mD, with an effective porosity of 0.208. The non-channel area has a permeability of 10 mD, with an effective porosity of 0.128. The Kv/Kh of the reservoir is 0.005, and the temperature is 194°F. The initial pressure is assumed to be close to saturation pressure at 1,050 psia. The field has two wells producing at very low rates, less than 50 bopd. A summary of the reservoir properties is shown in Table 1. A 13-component PVT EOS model was used to describe the fluid behavior as a function of pressure. This equation-of-state model was based on a detailed PVT study, and Peng-Robinson EOS12 with Peneloux correction13 was employed. The composition of the oil is shown in Table 2. The saturation pressure of the fluid is estimated to be 1,075 psia. The permeability and the current oil saturation map are shown in Figs. 3 and 4. The relative permeabilities have been matched by Corey functions. All information above is taken from Pudugramam.11 The results for the WAG injection scheme are shown in Figs. 5 and 6. The plotted results are cumulative oil production and pressure, as well as water and gas production rates. Field-scale simulations performed on field L were intended to test the impact of foam as a mobility control process. The foam-assisted, water-alternating-gas (FAWAG) process used showed a much lower CO2 utilization factor (CO2 injected, divided by enhanced oil recovered), compared to a regular WAG process. A comparison between WAG and FAWAG simulations is presented in Table 3.
SUMMARYAn isothermal, 3D, four-phase, compositional, equation-of–state (EOS) simulator with novel features was developed. The novel features include a foam module; a new compositional three-phase relative permeability module with hysteresis option; a three-phase hydrocarbon phase behavior module; a geomechanics module, corner point grid, visualization, and efficient formulas needed to solve the pressure equation. The simulator can simulate various recovery processes, such as primary and secondary waterflooding, and miscible and immiscible gas flooding. However, it includes several mobility control options, such as foam. This makes DOE-CO2 an advanced tool for scoping studies, and for simulating foam and mobility control processes in pilot or field applications. The simulator can be downloaded here: http://www.cpge.utexas.edu/?q=UTDOECO2. ACKNOWLEDGMENTS The work described in this article was based on work done on DOE project FE-DE0005952. Mojdeh Delshad (UT) was the principal investigator. The co-PI’s working on three distinct areas of research (phase behavior, gridding and geomechanics) were Gary Pope, Mary Wheeler and Kamy Sepehrnoori. REFERENCES
|
||||||||||||||||||||||||||||||||||||||||||||||||||||||||||||
- What's new in production (February 2024)
- U.S. operators reduce activity as crude prices plunge (February 2024)
- U.S. producing gas wells increase despite low prices (February 2024)
- U.S. oil and natural gas production hits record highs (February 2024)
- Dallas Fed: E&P activity essentially unchanged; optimism wanes as uncertainty jumps (January 2024)
- Enhancing preparedness: The critical role of well control system surveys (December 2023)
- Applying ultra-deep LWD resistivity technology successfully in a SAGD operation (May 2019)
- Adoption of wireless intelligent completions advances (May 2019)
- Majors double down as takeaway crunch eases (April 2019)
- What’s new in well logging and formation evaluation (April 2019)
- Qualification of a 20,000-psi subsea BOP: A collaborative approach (February 2019)
- ConocoPhillips’ Greg Leveille sees rapid trajectory of technical advancement continuing (February 2019)

