STANISLAW MAZUR, ARKeX, and NEIL HODGSON, Spectrum
 |
| A plane captures data during an airborne gravity gradiometry survey for ARKeX. |
|
This joint article examines how ARKeX, a provider of non-seismic geophysical services and data, together with Spectrum, a multi-client services and seismic imaging company, has created an exploration framework for Namibia and western South Africa, through the use of integrated interpretation of 2D seismic and potential field data. This article demonstrates how gravity and magnetic data, constrained by high-quality 2D seismic, can provide a fast, effective method for the structural modeling of frontier basins, in particular the crustal architecture of the Namibian passive margin, and the distribution of petroleum basins. To achieve this objective, ARKeX and Spectrum mapped structural elements, updated basin definitions and resolved the extent of different crustal types at the passive margin studied.
The ongoing “Digital Atlas” project provides exploration teams with a robust, cohesive and consistent structural, tectonic and kinematic framework for the region, with which they can review their geological concepts and exploration targets. This will lead to more focused, quantitative modeling within the selected offshore basins.
The area of interest is in the geologically complicated area of a volcanic passive margin created during late Mesozoic break-up of Gondwana. Despite its complex geodynamic setting, the Namibian and South African Atlantic margins remain one of the world's frontier petroleum exploration areas, whose structure and tectonic evolution have major implications for hydrocarbon distribution and maturation.
METHODOLOGY
With this project, the objectives were to compile a comprehensive structural data set for offshore Namibia and western South Africa, based on a GIS platform, and to apply the kinematic implications of the results obtained to redefine basin definitions in the area. One key issue addressed in the study was the redefinition of the major structural and tectonic elements by mapping them, using open-source gravity and magnetic data information, and reviewing previous results and interpretations. Another important issue was the establishment of basin and depression definitions by using gravity data to define structural depressions; using the structural framework to define basin boundaries; and making use of isopach maps, and other public domain data, to estimate sediment thickness and locate depressions.
The study also aimed to compile depth-to-basement estimates and basin structure imaging, using the 2D gravity and magnetic modeling of seismic lines provided by Spectrum. 3D structural modeling was also used to integrate geological information available, using 3D forward and inverse gravity modeling, and the results of 2D modeling.
THE NAMIBIAN PASSIVE MARGIN
The structure of the Namibian and western South African passive margin is characterized by the presence of two strike parallel gravity highs, Fig. 1. The internal high corresponds to the large basement ramp of the Atlantic Hinge Zone, a prominent flexure in the base of syn-rift succession. The external high is not necessarily related to the distal basement ramp, but it may represent higher density transitional crust intruded by igneous rocks.
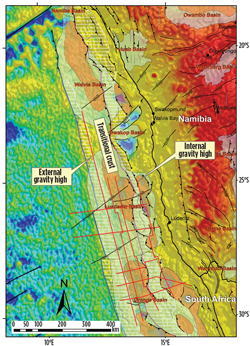 |
| Fig. 1. Sedimentary basins, gravity highs and structural interpretation along the Namibian/South African passive margin overlaid on isostatic gravity. Gravity highs are represented by white, horizontally-hatched polygons. Sedimentary basins and structural depressions are shown as semi-transparent bluish and maroon polygons, respectively. The thick blue line represents the boundary between oceanic and transitional crust, and the thick purple line is the boundary between continental and transitional crust. Red lines show Spectrum seismic coverage used in the study. |
|
The gravity highs define the boundaries of three main crustal types across the Namibian and South African passive margin. From east to west, the crusts are: continental, transitional and oceanic. The Atlantic Hinge Zone represents the western limit of continental crust, with normal, or only moderately reduced, thickness.
Sedimentary basins situated to the east of the Hinge Zone, though probably not very deep, may contain pre- and early syn-rift successions, with a variety of potential source rocks. The maturity of organic matter in those basins should not be too high and exceed the oil window, due to a limited overburden.
Transitional crust comprises a zone of gravity lows to the west of the Atlantic Hinge Zone and the external gravity high, Fig. 1. The latter may correspond to a distal basement uplift, or, more likely, a high-density igneous basement. Regardless of which interpretation is preferred, a thick syn-rift succession cannot be expected in that area.
The thickness of syn-rift sediments would be reduced above the uplift, or its lower section would be entirely missing above a juvenile basement. Instead, gravity lows between external and internal gravity highs may correspond to highly-extended crust. If this is the case, stretching would generate a structural depression, providing a large accommodation space for syn-rift volcanic deposits and sediments. A chain of depocenters in that area should be characterized by the increased thickness of syn-rift volcano-sedimentary succession, due to it being the main locus of pre-break-up deposition.
DEFORMATION HISTORY
The structural analysis has helped to identify two major deformation events in the evolution of the passive margin. These tectonic events have led to structuration of basement and overlying sediments during rifting, and after continental break-up. Each event is represented by a specific group of structures that have similar orientation and kinematics. Cross-cutting relationships allow us to recognize the succession of tectonic phases.
Several north-south trending segments of rift grabens are clearly visible from the gravity data, Fig. 2. These probably formed during the initial phase of rifting at the Namibian/South African passive margin. Therefore, they are oblique to: the boundary between transitional and oceanic crust; the Atlantic Hinge Zone; and more common northwest-southeast trending segments of rift grabens.
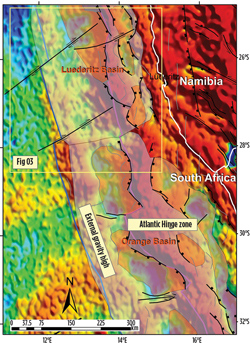 |
| Fig. 2. Rifting-related, north-south to northwest-southeast-trending normal faults and right-lateral, east-northeast by west-southwest-trending strike-slip faults overlaid on free-air gravity. Sedimentary basins and structural depressions are shown as semi-transparent bluish and maroon polygons, respectively. The thick blue line represents the boundary between oceanic and transitional crust, and the thick purple line is the boundary between continental and transitional crust. |
|
The qualitative interpretation highlights the possibility of either the rotation of extensional stress in time, or reactivation of pre-existing basement weakness zones during rifting. The cause for the changing orientation of rift segments will be determined with additional data.
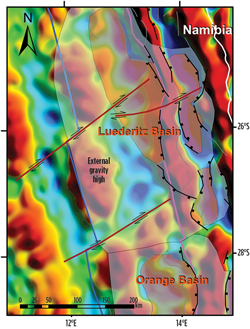 |
| Fig. 3. Right-lateral offset of gravity anomalies along the east-northeast by west-southwest-trending strike-slip faults (highlighted as dark brown). Structural interpretation is overlaid on 30-to-150-km band pass-filtered Bouguer gravity. Other symbols are as in Figs. 1 and 2. |
|
The Atlantic Hinge Zone, the boundary of transitional and oceanic crust, and several other smaller features, has been cut and displaced by a set of east-northeast by west-southwest to northeast-southwest-oriented right-lateral strike-slip faults, Figs. 2 and 3. These faults must be younger than continental break-up, but their precise age remains unknown. The kinematics of the faults in question is verified by several examples of right-laterally displaced gravity anomalies, Fig. 3.
In our interpretation, the northeast-southwest-trending faults do not represent a direct continuation of oceanic fracture zones, and were not created as proper transfer zones. The origin of right-lateral faults is, rather, related to a clockwise rotation of Africa, and the resultant, regional, west-northwest-by-east-southeast compression along the Namibian/South African passive margin. This may even be associated with the Late Cretaceous plate reorganization caused by the acceleration of spreading along the segment of the Central Atlantic between Mauritania and Spain (e.g., Fairhead and Wilson, 2005).
Alternatively, the right-lateral faulting may have been a regional expression of transcurrent displacement between the Falkland Plateau and the southern tip of Africa. Of course, it should not be discounted that right-lateral displacement at the Namibian/South African continental margin has only a local reason.
SEDIMENTARY BASINS
The definition of a sedimentary basin varies, according to the objectives of a given study. From a structural point of view, a basin will be the accommodation space that was created between the major faults defining the basin boundaries. From a petroleum exploration point of view, the outline of a basin is much broader, and can extend to include the accommodation space beyond the limits of the structurally defined basin, where they contain sediments that were deposited after the major tectonic phase that created the basin itself.
The following basin and sub-basin definitions were adopted in the study:
- Basins are units extending over the structural boundaries to include the full sedimentary cover of considerable thickness.
- Depressions (depocenters) are units bounded by structural elements.
While defining the basin outlines, positive and negative gravity anomalies were interpreted as structural highs and lows, respectively. The gravity field usually highlights density contrasts between basement and sedimentary cover. However, in some rare cases, the gravity lineaments can be entirely related to density variations within the basement rocks. Some caution must be attached to the interpretation of gravity data, when it is not verified by other data.
The overall structure and crustal architecture of the Namibian/South African passive margin, as revealed by offshore gravity data, allows for the identification of two chains of structural depressions, Fig. 1:
- Inner basins on proper continental crust between the Atlantic Hinge Zone and the coast. They should contain pre- and syn-rift sediments, and a reduced post-rift succession.
- Outer basins on stretched transitional crust, in-between two dominant gravity highs. Those basins should comprise the increased thickness of syn-rift deposits.
Of course, the entire passive margin experienced post-break-up thermal sagging and, thus, the major sedimentary basins of the Namibian/South African margin overstep the Atlantic Hinge Zone, and link the two types of structural depressions defined above.
2D GRAVITY MODELING
The 2D models were built upon the seismic lines provided by Spectrum. The transitional crust represents highly-attenuated continental crust subjected to intense syn-rift stretching.7 Along with that, the Atlantic Hinge Zone not only correlates with the flexure in the floor of the syn-rift basin, but it also coincides with a zone of Moho necking.
Consequently, the thickness of crystalline crust beyond the hinge zone may be reduced to circa 10 km. On the other hand, this stretching model is not necessarily applicable to the Namibian passive margin, as it is a volcanic margin. Because seaward dipping reflectors (SDRs) are clearly visible throughout the seismic sections, we can expect abundant volcanic material within a syn-rift succession and, potentially, widespread igneous rocks intruding and underplating the basement.
Prior to the modeling exercise, a new Moho map was generated for offshore Namibia and western South Africa to independently constrain the Moho position in the initial 2D models. Bouguer corrected Sandwell, and Smith (2009) gravity data were inverted for Moho depth, using in-house software developed by ARKeX. The theoretical basis and details of the inversion procedure are described in Barnes and Barraud (2012).
In addition to better calibrating the depth of the derived surface, Moho horizons digitized from three seismic refraction studies, Mamba 1 and 2 (Bauer et al., 2000) and Springbok (Hirsch et al., 2009), were used. The accurate parameterization of the inversion process allowed for a reasonable match to the refraction seismic data, but it also precluded short wavelength undulations from the solution obtained, Fig. 4.
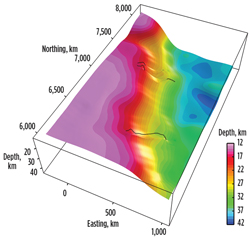 |
| Fig. 4. Block diagram showing Bouguer gravity data inverted for Moho depth. Depth to Moho horizons derived from the refraction data are shown as dashed lines. |
|
Spectrum marine gravity data and 2D seismic lines were used to build 2D models. Because forward modeling provides non-unique solutions, we successfully tested two alternative geological models for the passive margin architecture, both satisfying the observed gravity data, Fig. 5. Both models assume that a syn-rift succession is a mixture of basaltic volcanic material and clastic sediments. The presence of SDRs in a seismic image corroborates the presence of numerous sub-aerial lava flows, with a large lateral extent.5 The models differ in the assumed structure of transitional crust. The first model, called “A,” presumes that transitional crust is uniformly of basaltic nature, Fig. 5, and was created through magmatic addition during rifting.
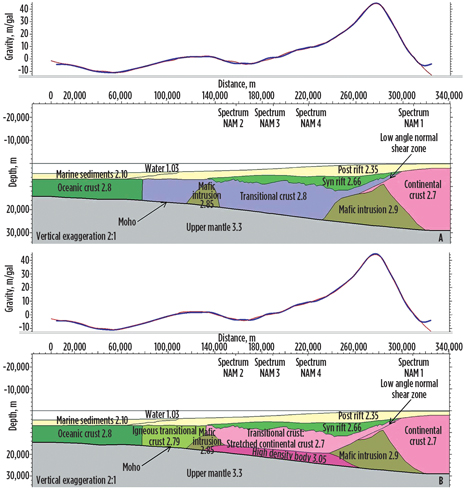 |
| Fig. 5. Two alternative 2D-gravity forward models for a seismic line crossing the Namibian margin in the east-west direction. Upper panel (A) shows a model with transitional crust of uniformly basaltic composition. Lower panel (B) presents a model, where transitional crust is a combination of stretched continental crust, underplated high-density body and pre-break-up igneous segment. |
|
The second model, “B,” postulates that the majority of transitional crust represents a combination of stretched continental crust and high-density underplated material, Fig. 5. However, the outer margin of transitional crust in this model is of igneous origin, and it was emplaced along a future spreading center, shortly prior to break-up.
CONCLUDING THOUGHTS
The integration of 2D seismic and potential field data generated an increased subsurface understanding of one of the world's leading frontier petroleum exploration areas. To eliminate the ambiguity in recognizing the source of the gravity signal, 2D forward modeling was calibrated by using the outcomes of a 3D gravity inversion for the Moho surface. This approach extends the limits for reliable reconstruction of subsurface structure, and allows for two alternative interpretations of transitional crust architecture to be considered.
To discriminate between them, the modeling of magnetic data would be essential. Furthermore, the depth-to-basement estimates from 2D forward models can, in turn, be used to further constrain a gravity inversion for a top basement horizon. This approach will allow for the verification of qualitative interpretation results and the testing of basin definitions applied in the study. The “digital atlas” for Namibia and western South Africa demonstrates a method of building a structural framework for exploration activities that can be consistently applied to large areas of frontier petroleum basins. 
REFERENCES
1. Barnes, G, and J. Barraud, “Imaging geologic surfaces by inverting gravity gradient data with depth horizons,” Geophysics, v. 77 (1), p. G1–G11, 2012.
2. Bauer, K., S. Neben, B. Schreckenberger, R. Emmermann, K. Hinz, N. Fechner, K. Gohl, A. Schulze, R. B. Trumbull and K. Weber, “Deep structure of the Namibia continental margin as derived from integrated geophysical studies,” Journal of Geophysical Research, 105(B11), 25829–25853, 2000.
3. Fairhead, J.D., and B.M. Wilson, “Plate tectonic processes in the South Atlantic Ocean: Do we need deep mantle plumes?,” In: Plates, Plumes and Paradigms, ed. G. R. Foulger, J. H. Natland, D. C. Presnall and D. L. Anderson, 537–553. Geological Society of America Special Paper 388, Boulder, Colo.: Geological Society of America, 2005.
4. Hirsch, K.K., K. Bauer and M. Scheck-Wenderoth, “Deep structure of the western South African passive margin—Results of a combined approach of seismic, gravity and isostatic investigations,” Tectonophysics, v. 470, p. 57-70, 2009.
5. Jackson, M., C. Cramez and J-M. Fonck, “Role of subaerial volcanic rocks and mantle plumes in creation of South Atlantic margins: Implications for salt tectonics and source rocks,” Marine and Petroleum Geology, v. 17, p. 477-498, 2000.
6. Sandwell, D.T., and W. H. F. Smith, “Global marine gravity from retracked Geosat and ERS-1 altimetry: Ridge segmentation versus spreading rate,” Journal of Geophysical Research, v. 114, B01411, 2009.
7. Unternehr, P., G. Péron-Pinvidic, G. Manatschal and E. Sutra, “Hyper-extended crust in the South Atlantic: In search of a model,” Petroleum Geoscience, v. 16, p. 207-215, 2010.
|
The author
STANISLAW MAZUR is a new ventures geologist at ARKeX, where he is responsible for technical supervision of multi-client interpretation projects. Mr. Mazur was previously a senior structural geologist at GETECH. He was a Visiting Research Fellow at the University of Leeds during 2008-2011, and has a Ph.D. degree in geology from the University of Wroclaw, Poland.
NEIL HODGSON has been working for Spectrum for the last year, leading a team to evaluate and capture the hydrocarbon play systems behind Spectrum's 2D multi-client data. Prior to this, Mr. Hodgson worked as a geologist in oil exploration.
|
|


