JOHAN MATTSSON, JOEL SKOGMAN, ANWAR BHUIYAN, ALLAN MCKAY and CHRIS ANDERSON, Petroleum Geo-Services
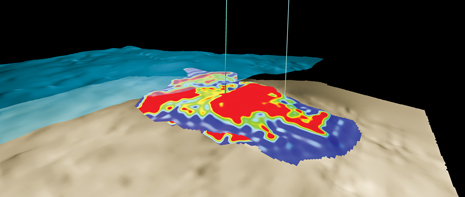 |
| An example indicative of the type of 3D subsurface images that can be produced by PGS’s latest towed streamer EM system. |
|
A newly developed, towed streamer electromagnetics (EM) system was used to acquire data over Mariner oil field in the UK North Sea during 2012. Electric field data were acquired with a single vessel, using a horizontal bipole source and sensors housed in a towed streamer. The data were acquired in a densely sampled grid, to cover a 3D subsurface volume containing the oil reservoirs. The target oil field was selected to test the ability of the EM method to detect oil reservoirs in a more complex geological setting than had previously been attempted. Complexity, in this case, means the proximity of a multi-layered resistive oil-charged reservoir to a resistive chalk “basement.”
In situations like this, it is proposed that information from seismic data, well logs and preliminary 1D EM inversions should be used to create a detailed background model to guide the 3D EM inversion. Here, the targets are the proposed resistive anomalies associated with oil-charged sands in the Heimdal and Maureen intervals, situated on top of each other at burial depths below mud-line of 1,250 m and 1,450 m, respectively. The Maureen reservoir sits on top of a resistive chalk layer, and the overburden predominantly consists of shale. The water depth in the area varies between 90 m and 120 m. In this case, an integral equation-based, regularized conjugate gradient method was implemented to obtain the 3D inverted resistivity.
INTRODUCTION
Controlled source electromagnetic (CSEM) marine surveys have traditionally been conducted, using ocean bottom node-based systems. The EM receivers are placed as autonomous recording stations on the seafloor in a linear or areal pattern, typically with separations of 1 to 3 km. A horizontal electric dipole source is then towed close to the seafloor, emitting a constant source signal, which is typically a modified square-wave sequence. The towed streamer EM method offers an alternative approach, focusing on efficiency, and EM and seismic joint acquisition. The proprietary PGS Towed Streamer EM system made the transition from prototype to a commercially available service offering in October 2012. The similarities to towed streamer seismic acquisition are obvious, and the advantages are all directed toward optimized performance and improved efficiency. These include acquisition speed at 4 to 5 knots, fixed source-receiver geometry and densely populated common mid-point sampling. The real-time quality control and on-board processing facilitate faster review of the transverse resistance of a prospective target reservoir. One of the survey areas included in the October 2012 program was the Mariner heavy oil field, in UK North Sea Block 9/11a. A dense grid EM survey (lines separated by 500 m) was acquired to detect and delineate the presence of hydrocarbons within Maureen and Heimdal.
The towed streamer system configuration is described briefly here, followed an overview of the resistivity model-building, to create a starting model for 3D inversion, and, finally, an integral equation based on the 3D inversion, itself.
ACQUISITION CONFIGURATION
A layout of the acquisition system, when configured for simultaneous EM and 2D seismic acquisition, is shown in Fig. 1. The bipole electric current source is 800 m long, with a towing depth of 10 m. The source runs at 1,500 A, and the source signal is user-selectable. In this case, an optimized, repeated sequence (ORS) was implemented. It can be viewed as a square wave (alternating between +/- 1,500A), with twice the density of the discrete harmonics seen in a monochromatic square wave. The signal sequence is 120 sec long, with the source active during the first 100 sec, followed by 20 sec of no signal that are used for background noise estimation and noise reduction processing.
 |
| Fig. 1. The layout of the acquisition system configured for simultaneous acquisition of EM and 2D GeoStreamer seismic. The 800-m-long bipole is towed at 10 m, emitting a 1,500-A source signal. The EM streamer has 44 effective offsets from 0 to 7,700 m, and it is towed at a nominal depth of 100 m. The de-ghosted seismic GeoStreamer is towed at a 20-m depth, and the towing speed is 4 to 5 knots. |
|
The maximum, nominal water depth for the Towed Streamer EM system is 400 m. Greater water depths are possible, provided feasibility modeling indicates that the target is sufficiently large, relative to burial depth, and/or has a sufficiently high transverse resistance to cause a detectable anomaly.
A number of different noise reduction methods have been implemented for towed streamer EM operations, as described by Mattsson et al.¹ Stochastic noise is attenuated in two different ways. First, the dense sampling, both within the streamer and along the survey lines, facilitates noise reduction by stacking that improves S/N by a factor of , where “N” is the number of stacked signals. The second method is known as the low rank approximation, based on singular value decomposition. It takes advantage of the fact that the signal only occupies discrete frequencies, whereas the stochastic noise is spread throughout the spectrum. By identifying the discrete signal frequencies, all noise between these frequencies can be removed.
SURVEY LAYOUT
The survey consisted of 10 lines separated by 500 m. The length of each line was about 15 km. Each line recorded 60 “shots” of 120 sec in length.
TOTAL UNCERTAINTY IN THE EM DATA
Estimating the uncertainty in the frequency response data as a function of signal is an important aspect of the processing and analysis of the acquired data. In particular, the total uncertainties are often used as data weights in inversion algorithms. In the 3D inversion described below, the uncertainties are also used in a regularization update algorithm.
|
|
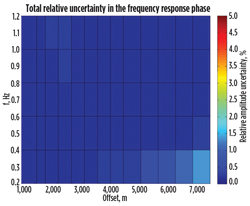
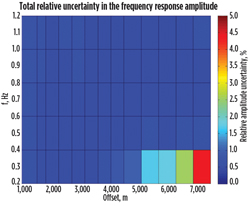
| Fig. 2. The estimated total relative uncertainty in the frequency response amplitude (top) and phase (bottom) for one of the survey lines at the Mariner heavy oil field. |
|
Noise, or uncertainty, originates from several sources, including the measurement system, positioning errors and the electric field noise in the measurement. The total uncertainty in the frequency responses was calculated for the data acquired in the grid over the Mariner area. Typical relative uncertainties in this data set are visualized in Fig. 2. The maximum relative uncertainty is seen to be below 5% in amplitude and below 2% in the phase. For most of the frequencies and offsets, the uncertainties are below 1%, in both the amplitude and phase. The dominant part of the uncertainty comes from the electric field noise for the low frequencies and long offsets. The sum of measurement and navigation uncertainties is below 1%.
STARTING 3D RESISTIVITY MODEL
Seismic data and well log data have been used to extract the geological structure in the area. A resistivity model, 3D structures embedded within the 1D plane-layer background, has been built using seismic and petrophysical information. Initial resistivity values in each of the layers within the model have been estimated from well logs, and the resistivity values have then been further refined by 1D differential evolution inversion (Mattsson et. al., 2010). Structural interfaces interpreted from seismic data, and the 3D resistivity grid prepared from these structures, are shown in Fig. 3. This model has then been used as a starting and “a priori” model in the 3D inversion described in the next section. A 3D bathymetry part has also been introduced in this model, which has been included in Fig. 3.
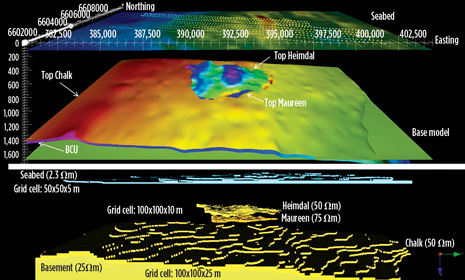 |
| Fig. 3. A 3D resistivity model built from seismic and well logs. 1D inversion has been used to modify the resistivity values. |
|
3D INVERSION
As a forward modeler, a code based on a volume integral equation is used as part of the general framework of the 3D inversion applied on the towed streamer EM Mariner data. The inversion is formulated as the problem of locating the minima of a specific objective function, with respect to a physical, reasonable resistivity model set. The objective function is defined as the sum of the L2-norms calculated from the data misfit functions, with respect to the difference between the measured frequency responses, and the modeled frequency responses associated with the resistivity model, and the deviation between an “a priori” and the inverted models. The regularization term in this inversion scheme is considered in the model space. The purpose of regularization is to guide the inversion to physically allowed models, and the balance between the two terms is controlled by a regularization parameter. The algorithm used for the minimization is based on the Gauss-Newton method, with a line search suggested as in Abubakar et al. (2008). A more detailed description of the inversion problem formulation is given in Enstedt et al. (2013).
In particular, the data weights in the objective function are based on Gribenko and Zhdanov (2007) for balancing the dynamic range in the data. The model weights in the regularization term are based on a combination of weights, which can be found in Zhdanov (2002), ensuring that a physically realistic resistivity model is obtained.
Especially in the Mariner case, the following workflow and regularization approach has been utilized:
3D grids for the bathymetry and the chalk layer have been created from echo-sounder data and seismic horizons with resistivity values from 1D DE inversions. An inversion grid covering both the Heimdal and Maureen reservoirs is also created, where the models of these reservoirs shown in Fig. 3 are used as the start and “a priori” model for the 3D inversion. This grid sits right on top of the chalk grid. The remaining part of the model in Fig. 3 is built as a 1D plane-layer structure with resistivity values obtained from the 1D inversions.
Computed scattered fields from the bathymetry and the chalk anomalies were then subtracted from the measured frequency responses.
The electric field coupling between the inversion grid (Heimdal and Maureen), the chalk and the bathymetry grids was neglected, with an estimated mean error of around 1%, which is accepted as sufficiently low. Hence, subtracting the computed bathymetry and chalk layer fields from the inversion data is a reasonable approach, provided that these 3D models are sufficiently accurate.
The regularization was done against the starting model as the “a priori” model, and the “vertical support” method was used.
A new trust region method, based on a transformation of the model space to a logarithmic space, where only allowed resistivity values exist, was used.
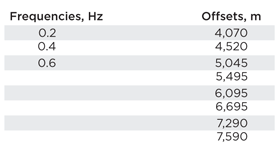
The system affords a broad range of frequencies and offsets, which are used and analyzed during the initial processing of the data and as input to the preliminary 1D inversions. As a result, it is possible to select a subset of data (Table 1) optimized for the 3D inversion. The motivation of the specific selection in frequency, and offset, is to keep the data with the highest sensitivity in the inversion grid covering the Heimdal and Maureen reservoirs.
| Table 1. Subset of data selected from the preliminary 1D inversion, optimized for the 3D inversion. |
|
|
The resulting resistivity values in the inversion grid, after convergence of the objective function value, are shown as depth slices, from 1,215 m down to 1,475 m, Fig. 4. The Heimdal resistive anomaly shows up as two laterally separated regions at depths between 1,255 m and 1,315 m. The maximum inverted resistivity is around 40 Ωm. The resistive anomaly associated with Maureen occurs at the bottom of the inversion grid and has higher inverted resistivity values. The lateral extent of this anomaly fits fairly well with the seismically interpreted structural outline (white boundary in Fig. 4). In all, this first inversion result seems physically reasonable. However, a check of the stability of this result, with respect to variations in the background model, which is kept fixed in this 3D inversion, remains to be performed.
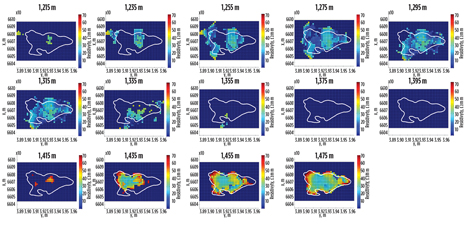 |
| Fig. 4. Colored patches show the inverted 3D resistivity models for the Heimdal (shallow) and Maureen (deeper) reservoirs. |
|
CONCLUSIONS
The inversion of the Towed Streamer EM system data, acquired over Mariner field, results in a resistivity anomaly volume that agrees well with the “a priori” structural knowledge of the Heimdal and Maureen reservoirs. Both the horizontal and vertical extents, as well as the resistivity values, are reasonable. The integral equation method used has shown to be stable and fast. However, in the relatively complex geology of the Mariner area, it is important to make use of structural information from seismic and well logs, to constrain the 3D inversion sufficiently. A check of the stability of this result, with respect to variations in the background model, which is kept fixed in this 3D inversion, remains to be performed, and this is the subject of ongoing work. 
ACKNOWLEDGEMENT
The authors thank Petroleum Geo-Services for its permission to present this work.
REFERENCES
1. Mattsson, J., P. Lindqvist, R. Juhasz and B. Björnemo, “Noise reduction and error analysis for a towed em system,” SEG, Las Vegas, 2012.
2. Mattsson, J., L. Lund, J. Lima, F. Engelmark and A. McKay, “Case study: A towed EM test at the Peon discovery in the North Sea,” EAGE, Barcelona, 2010.
3. Abubakar, A., T. Habashy, V. Druskin, L. Knizhnerman and D. Alumbaugh, “2.5D forward and inverse modeling for interpreting low-frequency electromagnetic measurements,” Geophysics, 73, F165-F177, 2008.
4. Enstedt, M., J. Skogman, and J. Mattsson, “Three-dimensional inversion of Troll West oil province EM data acquired by a towed streamer EM system,” 75th EAGE Conference, Expanded Abstracts, 2013.
5. Gribenko, A., and M. Zhdanov, “Rigorous 3D inversion of marine CSEM data based on the integral equation method,” Geophysics, 72, WA73-WA84, 2007.
6. Zhdanov, M., Geophysical Inverse Theory and Regularization Problems, Elsevier, 2002.
|
The author
JOHAN MATTSSON is a chief geophysicist at Petroleum Geo-Services (PGS), where he provides technical expertise and guidance for the development of the towed streamer EM technology. Previously, he was head of the EM research section, with a focus on system design and signal processing. He earned a Ph.D. in engineering mechanics in 1996 from Chalmers University of Technology, Sweden. Dr. Mattsson has worked primarily with forward and inverse wave propagation modeling, as well as analysis of experimental data.
JOEL SKOGMAN is a senior scientist with the PGS EM Geophysics group. He has worked for six years with the development of modeling and inversion algorithms, and the interpretation of data. In 2007, he earned an M.S. degree in engineering at the Royal Institute of Technology in Stockholm
ANWAR BHUIYAN is a senior geophysicist with the PGS EM Processing and Interpretation team, haing joined PGS in 2011. He served as a senior geophysicist at EMGS from 2006 to 2010. Mr. Bhuiyan earned a Ph.D. in geophysics from the Norwegian University of Science and Technology (NTNU) in 2010. He also did postdoctoral research at NTNU from 2010-11.
ALLAN MCKAY is section manager of the PGS EM Processing and Interpretation team. Since joining PGS, in 2008, he has been responsible for a number of projects. He earned a Ph.D. in geophysics from Edinburgh University in 2004.
CHRIS ANDERSON is a V.P. within PGS’s commercialization group. He earned a B.S. degree in applied physics at the City of London Polytechnic in 1989, and has since worked in various oilfield service companies, gaining expertise in seismic and EM data processing and quality metrics
|
|


