Integrated production modeling allows comparison of subsea and conventional lift technologies
To anticipate and increment oil production, subsea gas-liquid separation is the most advanced of available technologies for deepwater applications. As shown in two case studies, Integrated Production Modeling is the best way to estimate incremental oil recovery and compare with other artificial lift technologies.
G. N. R. TEIXEIRA, Petrobras/UNICAMP; and D. J. SCHIOZER, UNICAMP
Reservoir engineers are responsible for forecasting the future reservoir behavior. With the technological evolution of hardware and software in the past decades, reservoir simulation has become an important tool for engineers, since it incorporates information from geology, geophysics and engineering, allowing more complexity to the model. Current simulators also estimate production system pressure drops through the use of Vertical Lift Performance tables (VLPTs). An example is shown in Fig. 1, where the production system is represented by four VLPTs. However, this approach has some limitations: the thermal calculation is normally not considered; not all the field operational constraints are monitored; complex production systems cannot be represented by some commercial simulators; and for a single modification, it is necessary to generate a new VLPT.
Reservoir simulation, coupled with production facilities, also known as Integrated Production Modeling (IPM) or Integrated Asset Modeling (IAM), is an approach that combines reservoir, production and process models into a single assessment, thus allowing simulation of the entire oilfield system. Several IPM advantages have been addressed, such as: more effective, efficient field management; pressure interaction between subsurface and surface; mixing of different fluids and flow assurance; accounting for facility constraints and identification of system bottlenecks and backpressures; simulation of multiple reservoirs producing to a complex production system; and availability of important information for decision-making that would not be possible with just reservoir simulation. The importance of IPM can be observed by the growing number of papers published over the years—its development is summarized well by Rotondi et al.1 Recent discoveries offshore Brazil in deepwater fields are leading the industry to invest in new technologies to increase projects’ oil recovery factors and Net Present Values (NPVs). Subsea processing is being used to achieve this goal. It can be defined as any treatment of the produced fluids, performed on the seabed prior to reaching the offshore installation. The key element to improving production rate and ultimate recovery is increasing pressure drawdown of the reservoir by reducing the backpressure imposed by the production system (wellbore, flowlines, manifolds, risers etc.).2 Additional production can be achieved through two main technologies: 1) flow boosting; and 2) separation. While the first technology is driven by increasing fluid pressure through multiphase pumping for oil reservoirs, and via wet gas compressors for gas reservoirs, the second method includes phase separation with posterior pumping. Multiphase pumping is a proven technology, with a number of significant field applications. However, the differential pressure of current pumps limits usage for deepwater fields. On the other hand, subsea gas-liquid separation allows use of centrifugal single-phase pumps that might yield a differential pressure higher than 200 kgf/cm², depending on the fluid characteristics.3 According to Jansa and Dessenberger, incremental recovery from subsea processing should be estimated, using the IPM approach to ensure that the most reliable, efficient technology is applied.2 The motivation for the present work was the need to quantify incremental oil recovery achieved through subsea processing, to allow the possibility of comparing which technology is more economically attractive. Therefore, the objective is to evaluate the pros and cons of using subsea gas-liquid separation as the main artificial lift method of a reservoir with characteristics similar to those observed in the recent discoveries in Brazil, comparing its performance with traditional gas lift technology. SUBSEA GAS-LIQUID SEPARATION Subsea gas-liquid separation consists of the gas phase separation from the liquid. It is considered a boosting technology, developed to increase production, or produce at higher rates that conventional lift technologies would allow. The separated gas flows through one line, and the liquid is pumped through a second line to the surface facility, Fig. 2. This technology’s many advantages make it attractive for deepwater projects. These include flow assurance (management of flow instabilities, such as severe slugging, hydrate formation); the reduction of the primary separator on the surface facility; and more efficient pumping (use of single phase/hybrid pumps that handle up to 20% of gas void fraction, GVF).3
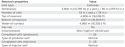
Although the testing of subsea processing equipment began in the 1960s and 1970s, the “first” subsea separation occurred only in the last decade (2001), with NorskHydro’s Troll C pilot project and the VASPS (Vertical Annular Separation and Pumping System) used by Petrobras, Eni and ExxonMobil in a joint project. While the technology applied in the Troll C pilot project was a horizontal separator for three-phase separation with water reinjection, the VASPS separator is basically a “dummy” well drilled on the seafloor with an ESP installed inside of it. Building on Troll C’s success, Statoil (formerly Hydro) installed a similar subsea separation, boosting and injection (SSBI) station in Tordis field. For its latest development projects, Parque das Conchas (BC-10, Brazil) and Perdido (Gulf of Mexico), Shell concluded that a system with a subsea caisson separator and ESP was the preferred scheme, a technology similar to the VASPS concept.4 For the Pazflor oil development in Angola, where production started in 2012, Total decided to use a vertical separator with hybrid pumps on the seabed.5 Despite the advantages of subsea gas-liquid separation presented earlier, and the firsts applications in real fields, there is still much work to be done, to mature this technology, including: 1) complex petroleum chemistry shall be carefully taken into consideration, looking, for tight emulsion formation or foaming tendency enhanced by gas entrainment phenomena, and naphtenate formation which depends on temperature, pressure, pH etc.; 2) level control measurements (regulation valves and fast-moving actuators); 3) sand control/handling (accumulation, removal); and 4) power source and electric power distribution.3 Another important issue relates to the separator, which is limited in size, weight and wall thickness. As water depth increases, horizontal separators become less attractive, because of weight and cost. Separators, to date, have been sized less for separation performance and more for maximum marine spread crane lift capacity.3 As the industry moves to deeper and higher pressure applications, the need for more compact, efficient separators increases, such as the inline separation technology under development.6 The remainder of this article is organized into three sections. First, the characteristics and considerations of the reservoir, production network and fluid models used in this work are presented. Following that are the results for the two applications using synthetic reservoir models. Case Study 1 used a homogeneous reservoir model, so the comparison focuses only in the artificial lift technologies. Case Study 2 used, for comparison, a heterogeneous reservoir model, built with real data to mimic the heterogeneity of a real reservoir. Finally, the conclusions are presented. MODEL DESCRIPTION The results presented in this article were obtained using the Petroleum Experts’ (Petex) software package (IPM Suite, version 8) for fluid characterization (PVTp), well modeling (Prosper), network modeling (GAP) and integration (Resolve) with CMG Black Oil simulator IMEX. The choices of the IPM Suite and IMEX reservoir simulator used are related, mainly due to availability of licenses. However, this work could also have been done with any with other software that allows the coupling of a reservoir simulator with production facilities. The most important issue is to recognize that integrated modeling might add value to projects under development, by considering the pressure interaction between subsurface and surface, even though the simulation time takes longer. IPM is referred to as the integrated modeling approach, rather than the use of Petex’s products. Among the two case studies presented, the first one evaluates the performance of gas lift and subsea gas- liquid separation in a homogeneous reservoir, so that the comparison focuses only on the artificial lift methods by removing any effects of reservoir heterogeneity. The second case is similar to the first, but it differs by considering a synthetic heterogeneous reservoir. The reservoir and production facility models used in this work are presented in the next sections. FLUID MODEL Although the principles describing the flow in a porous media and in a pipeline are different, the fluid that travels from the reservoir to the platform, or gathering center, is the same. Therefore, a consistency in the PVT model should be guaranteed, to avoid errors and instabilities during the simulation, as reported by.7 The fluid properties used in this work are listed in Table 1.
Reservoir, production and processing models have a different way of dealing with the fluid and, therefore, require a different input format for the fluid model. Despite that, the most important issue is to guarantee that the fluid has the same origin, which means the input format of the fluid model for each set of software comes from the same equation of state derived from one, or more than one, PVT lab result. In this case, the reservoir is represented by one PVT, in which the experiment was performed only at the reservoir temperature. An equation of state was created in PVTp, and an IMEX Black Oil PVT table format was generated, as well as one PVT table at reservoir temperature in the Prosper format. Since there is temperature variation during the flow in the tubing and pipelines, and there is information for only one temperature, black oil correlations for saturation pressure, gas-oil ratio (GOR), oil viscosity and oil formation volume factor were used to match the PVT table generated for Prosper. RESERVOIR MODEL Two reservoir models are used in this work: one homogeneous and one heterogeneous. Some reservoir properties common to both models are listed in Table 2. The option for vertical wells and a high reservoir depth was based on the idea of comparing the technologies, with the thought that subsea processing might be considered in the near future.
Although the heterogeneous reservoir model is a synthetic one, it has some complexity included to allow a better comparison of the technologies. It was constructed, based on a vertical session of 3,900 m between two wells. The properties between these points were estimated through Krigging. Figure 3 shows a section of the porosity and permeability maps, where one can observe layers of high permeability. Also, this model comprises five sets of relative permeability curves, depending on the lithology. For the homogeneous reservoir model, one set of relative permeability curves was used, and a porosity value of 20% and horizontal permeability of 250 mD was considered. PRODUCTION FACILITY MODEL The parameters used to model the production system are shown in Fig. 4a, for a gas lifted well, and in Fig. 5a, for a well with a Subsea Separation Unit (SSU). Figures 4b and 5b show how it was represented in GAP. The well was modeled in Prosper, and it represents the flow from the bottom of the well to the wellhead (subsea Christmas tree) with 5.5-in.-ID, tubing. Two types of VLPTs were generated and then imported in GAP, according to the production system. The horizontal line length for both systems is 7,000 m, and the total length, including the riser, is 9,774 m.
The multiphase line between the subsea Christmas tree and the SSU (Fig. 5a) was neglected, and the gas and liquid lines have the same length. To control production for satellite wells in the gas-lifted system, there is a choke valve on the FPSO, represented by a choke element in Fig. 4b. For the SSU, the choke valve to control the production is on the wellhead, and there is another control valve in the gas line on the FPSO to control the subsea separator’s pressure. Although Fig. 5b does not show any choke element, GAP calculates the pressure drop in the wellhead needed to control production. In this work, the pressure at the separator was not fixed, therefore, a choke element in the gas line was not included in the model. More information about the subsea system control is described by.5
where In this case, the downstream pressure (Fig. 5b) is calculated from the model to solve the pressure balance. The Δp and an estimate of the pump power for each time step of synchronization are obtained through command lines inside the Inline General element in GAP (yellow rectangle in Fig. 5b). Also, it is possible to select the desired GVF and, therefore, evaluate how the Δp changes, when an amount of gas goes through the liquid line (it might act as artificial lift, reducing the backpressure of the liquid line without causing any potential risk to pump integrity). Only the production network was modeled in GAP. Therefore, the operational conditions of the water injection system are controlled by the reservoir simulator. APPLICATION What follows are detailed analyses of the methods instituted, and results achieved, in Case Studies 1 and 2. Case study 1: Homogeneous reservoir. The main objective of case study 1 is to compare two artificial lift methods—gas lift and subsea gas-liquid separation. For that reason, a homogeneous reservoir model was selected, to exclude any effect of heterogeneity. The reservoir contains three oil producers and four water injection wells. Initially, three values for maximum liquid rate for each producing well were set. The production system for these scenarios contains 5.5-in.-ID, tubing and 8.0-in.-ID, pipeline. For the water injection system, the voidage replacement option was used in the reservoir simulator with a maximum BHP injection of 700 kgf/cm². Figure 6 illustrates some results from this first comparative analysis. The results clearly show that at lower rates (3,500 m³/d), both technologies produce the same quantity of liquid (Fig. 6a) and oil, Fig. 6b. However, as the maximum liquid rates constraint increases, the gas-lifted system seems to have reached its potential, while the subsea gas-liquid separation system could have produced more than 4,500 m³/d. Figure 6b shows what is typically expected for subsea processing technology applied in a green field: oil production anticipation, which was only possible because of the backpressure reduction, resulting in a lower wellhead pressure (Fig. 6c) and, consequently, increased pressure drawdown, Fig. 6d. Although higher production is good for the short term, because it increases NPV, one should always pay attention to the long term. Otherwise, the field’s oil recovery factor might be compromised. It has been shown that a higher liquid rate is produced through subsea gas-liquid separation. Since the option for voidage replacement was used to define the water injection strategy in the reservoir simulator, more water was needed to be injected to replace the volume produced with this technology, Fig. 6e. As a consequence, an earlier breakthrough, and a higher water production rate, are also expected, which might be observed in Fig. 6f. These six graphs show that different characteristics are observed, when a reservoir is being produced with gas lift and subsea gas-liquid separation. Therefore, a field development plan requires different capacity specifications for the water treatment plant and injection system in a platform. Increasing the pipeline diameter of the gas-lifted system from 8.0 to 10.0 in. reduced the backpressure and, thus, higher production resulted. With this modification, the gas-lifted system was able to produce 4,000 m³/d of liquid during the whole simulation period. However, it still would not work for the 4,500-m³/d case. The incremental oil production obtained with subsea gas-liquid separation was reduced for the 4,500-m³/d situation, though it is important to remember that the production has not reached its potential yet. Excluding all the costs associated with the subsea separation unit and gas lift, subsea gas-liquid separation is capable of reducing the costs associated with pipeline diameter. Figure 6a showed that both producing systems managed to produce 3,500 m³/d of liquid during the whole simulation period, with the voidage replacement option active. If there was a constraint for a maximum water injection rate for each well, how does that affect the reservoir’s production? Limiting the water injection rate impacted oil output for both producing systems. However, the impact was more significant for the subsea gas-liquid separation system, in which all the wells died for the 3,000-m³/d case. Also, it was possible to keep liquid production at the plateau rate longer with subsea gas-liquid separation than with gas lift, resulting in a higher oil rate for a certain period, before the decline rate increased. That was only possible, because the pressure drawdown increased for the subsea gas-liquid separation system, up to a point where it decreased substantially. Without replacing the same amount of produced fluid with water, the reservoir pressure went down below the saturation pressure, increasing the gas rate, as well as the pressure drop in the gas line. The same was not observed for the gas-lifted system, because the backpressure imposed by it is much higher, and it limited the production. Therefore, the reservoir pressure did not go below the saturation pressure. Although reducing backpressure is the main advantage of subsea processing systems, the results showed that the consequences of an inadequate reservoir pressure support strategy might be catastrophic. Therefore, results indicate that one of the key elements to extracting the advantages of subsea processing is pressure maintenance of the reservoir, since it is the energy that allows the fluid to flow from the bottom of the well, up to the subsea separation unit. Case study 2: Heterogeneous reservoir. The idea here, is to compare the performance of both producing systems in a realistic reservoir, which was built using real data. Three configurations will be used: 1) three oil producers and four water injectors; 2) three oil producers and six water injectors; and 3) two oil producers and four water injectors. Results observed with the homogeneous reservoir showed that pressure support is very important for subsea gas-liquid separation. Therefore, for the heterogeneous reservoir, it was necessary to re-allocate the injectors closer to the producers. The new locations of the injectors, as well as the locations of the producers, were not based on an optimization process. For all results shown, producers were always set to produce at potential, and the option for voidage replacement was used to define the water injection strategy in the reservoir simulator, without any maximum water injection rate constraint. The first results for liquid and oil production rates are illustrated in Fig. 7. The oil production rate curve (Figs. 7b, 7d and 7f) shows similar behavior observed for the homogeneous reservoir analysis (Fig. 7b). There was a higher oil rate for subsea gas-liquid separation during the earlier years of production, followed by a decline rate similar to the gas-lifted system. The only difference was that subsea gas-liquid separation was more attractive until 2022 for the homogeneous reservoir, while for the heterogeneous reservoir, the timeline was shortened to 2015, due to the reservoir characteristics (porosity and permeability, relative permeability curves etc.).
The liquid production rate for Configuration 1, shown in Fig. 9a for subsea gas-liquid separation, was expected to be higher during the whole simulation period, but that was not the case. Based on analysis with the homogeneous reservoir model, the observed behavior might have resulted from poor sweep efficiency. The addition of two more injectors (Configuration 2), and the removal of one producer (Configuration 3), shows that the liquid production rate was higher during the whole simulation period (Figs. 7c and 7d), which is a consequence of better sweep efficiency. Its impact might be seen clearly in the earlier years of the oil production rate. While Fig. 7b shows a small increase in oil production with a decline rate, Figs. 7d and 7f show much higher incremental oil production. Since a higher pressure drawdown can be achieved with subsea gas-liquid separation, the drainage area of a producer might be also higher. Therefore, to take full advantage of this technology, more injector wells are necessary, when there producers are close to each other, as in Configuration 1, if an aquifer is not present. If that is not possible, then working with a reduced number of producer wells would be recommended, with a higher distance between them, even though this might reduce total production during the first few years. Otherwise, it must be clear that, although incremental oil production might still be achieved, it will not be as high as it could be. This is just an indication, and further investigation must be made to draw more conclusions.
Configuration 2 also showed an increase in oil production for the gas-lifted system. This is visualized better in Fig. 8, where the incremental oil recovery rate, which is the difference in the oil production rates achieved with subsea separation and gas lift, is illustrated for the three configurations. Configuration 2 showed the highest incremental oil rate. It is also possible to observe the huge difference with Configuration 1, although it was the first configuration for which subsea gas-liquid separation became less attractive. However, economically speaking, Configuration 2 is more interesting. Configurations 1 and 3 had the same incremental oil rate up to a point, but Configuration 3 showed that subsea gas-liquid separation was more attractive for a longer period.
Table 3 summarizes the incremental oil volume obtained for the three configurations studied. A percentage of the incremental volume related to Configuration 1 is also presented. Configuration 3 showed the highest incremental oil volume. Since fluids flow naturally up to the subsea separation unit, the pressure drop inside the tubing increases significantly, as the water rate increases through the years. The tubing pressure drop clearly gets higher for subsea gas-liquid separation, confirming the need for a satisfactory reservoir pressure support strategy.
Gas lift injection would start around 2014, when the tubing pressure drop begins to increase. Figure 9a shows an increase in the liquids production rate, but that was related mostly to an increase in water production, rather than oil output. This was due to the reduction in tubing pressure drop, Fig. 9c. However, combining the technologies resulted in the highest oil rate, when the field was in the mature phase, Fig. 9b. With this extra help from gas lift injection, subsea gas-liquid separation was more attractive than gas lift during almost the whole simulation period, Fig. 9d. This might be a possible solution for mature field revitalization with subsea gas-liquid separation. If a good strategy for pressure support is implemented, the GOR does not increase substantially and, therefore, the gas production rate decreases through the years. The total gas rate may be below the designed separator specification to ensure efficient gas-liquid separation.
Table 4 summarizes the oil recovery factor for the 41 years simulated. Considering the original oil-in-place (OOIP) for the heterogeneous reservoir model of 55.447 x 10⁶ m³, the reservoir’s oil recovery factor increased 1.61%, when gas lift and subsea gas-liquid separation technologies were combined.
Combining subsea gas-liquid separation with gas lift is not the same as starting to produce with subsea separation and then changing it to gas lift, bypassing the separation unit. The oil production rate in Fig. 10 shows that changing the artificial lift method during the simulation yielded the worst oil production rate curve among the four options. A zoom of the circled area is also shown in Fig. 10b, where it is possible to better visualize the difference in oil production.
All the results presented in this article showed that an incremental increase in oil production could be predicted with subsea gas-liquid separation. Considering the oil production rate of Configuration 1 with subsea gas-liquid separation, is it be possible to have a similar curve with gas lift? If so, what would be necessary to achieve that? Results showed that the necessary pipeline and tubing diameters were 10.0 in. and 7.0 in., respectively, for the gas-lifted system to have the same oil production rate as subsea gas-liquid separation, Fig. 11. This comparison shows that it is possible to use subsea gas-liquid separation, to save CAPEX, to achieve a maximum liquid or oil rate with smaller diameters. CONCLUSIONS IPM was used to evaluate the positive and negative aspects of subsea gas-liquid separation, and to estimate incremental recovery compared to gas lift. Subsea gas-liquid separation achieved an incremental increase in oil production by increasing reservoir drawdown. Important observations include: Reservoir pressure maintenance is a key element in all artificial lift methods. The best results were obtained without a significant reduction in reservoir pressure Subsea gas-liquid separation tends to produce higher volumes, and the reservoir pressure is the necessary energy. Water injection should be designed properly for this technology. Combining subsea gas-liquid separation with gas lift showed that it is possible to produce more oil in mature fields. Although economic analysis was not considered in this work, it is possible to produce the same amount of oil with smaller tubing and pipeline diameters in subsea gas-liquid separation. Due to the complexity of the problem and the dynamic characteristics of the process, IPM is recommended to model this type of problem, and to evaluate the effects of the tested technologies. ACKNOWLEDGEMENT The authors thank Petrobras for its financial support. NOMENCLATURE VLPT = Vertical Lift Performance table REFERENCES 1. Rotondi, M., A. Cominelli, C. Di Giorgio, R. Rossi, E. Vignati and B. Carati, “The benefits of integrated asset modeling: lesson learned from field cases,” SPE paper 113831, presented at the SPE Europe/EAGE Annual Conference and Exhibition, Rome, Italy, June 9–12, 2008. |
||||||||||||||||||||||||||||||||||||||||||||||||||||||||||||||||||||||||||||||||||||||||||||


 and permeability maps of a 2D section of the heterogeneous reservoir model.")


, 2 (c and d) and")


 liquid production rate; (b) oil production rate; (c) tubing pressure drop; and (d) the incremental oil rate.")

 oil production rate; and (b) a zoom of the circled area, showing the difference in the oil production rate.")


