Are we over-fracturing horizontal shale wells?
Are we over-fracturing horizontal shale wells?
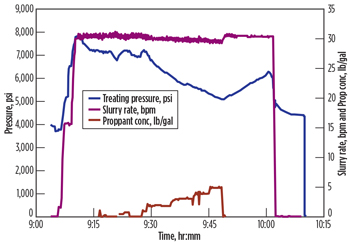
ALI DANESHY, Daneshy Consultants Int’lDuring a panel discussion at the 2013 World Oil ShaleTech conference, several questions were raised about the size of hydraulic fractures in horizontal shale wells. Specifically, are we over-fracturing horizontal shale wells? These queries beg the basic question: Can we determine what is the right fracture size? What made the question more pertinent were presentations that showed fracturing cost to be the major component of total well costs, often its biggest piece! Based on my reading of existing practices within the companies that I am familiar with, I offer my perspective on the subject. A comprehensive discussion of the question of fracture size needs to combine two other, even more important questions: spacing between individual fractures along the length of the horizontal well (or the number of fractures), and spacing between adjacent wells. FRACTURING VARIATIONS There are wide variations in existing fracturing practices between different reservoirs, locations, and even between different companies operating within the same reservoir. The main elements of fracturing decisions are often a number of key desired fracture characteristics. Once a successful fracturing recipe, with a reasonable production outcome is proven, it is accepted as the norm and small variations to this recipe are explored, by trial and error, to either reduce the costs, or increase operational and production efficiencies. To illustrate the wide fracturing practices, three typical treatments are presented below, followed by a discussion of the technical and operational basis of their designs. All three examples are from the Bakken formation; one in the U.S. and two in Canada. While, admittedly, there are differences between reservoir properties of the Bakken formation in the two countries—depth being an obvious one—the differences between fracturing practices are too large to be attributable to depth, alone. CASE HISTORY #1 A Bakken well in the U.S. was fractured in 30 stages, with each stage involving an average of 75,000 gal of slurry. The fracturing fluid was a cross-linked gel. Each treatment stage was injected at 30 bpm, using approximately 73,250 lb of proppant, with a maximum concentration of 5 lb/gal. The completion system was a ball-activated sliding sleeve in the toe section, and plug-and-perf in the heel. A typical chart of the treatment during one of these stages is presented in Fig. 1.
The decisions regarding the type of completion and detailed treatment design were partly influenced by the following considerations:
CASE HISTORY #2
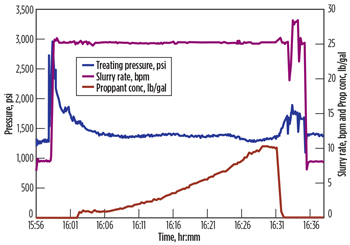
A Bakken well in Canada was completed with an openhole liner and fractured in 10 stages using a ball-activated sliding sleeve completion. The horizontal section length was about 5,000 ft. For each stage of fracturing, the slurry volume was 42,500 gal, proppant weight was around 106,000 lb, and maximum proppant concentration was around 10 lb/gal. Figure 2 shows a typical treatment chart for one of these stages. Various points influencing this selection were:
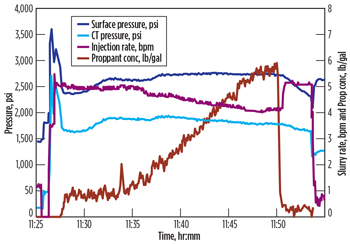
CASE HISTORY #3 Another well in the Canadian Bakken was completed with 4.5-in. liner and fractured in 20 stages using a dual-injection fracturing system. The horizontal section length was around 4,800 ft. The slurry volume for each stage was around 8,000 gal, with 11,000 lb of proppant. The injection rate was around 5 bpm. The maximum proppant concentration was 6 lb/gal, Fig. 3. Factors influencing this selection were:
A desire to minimize water production. The operator believes that rate is a controlling factor in creating fracture height, and therefore, uses very low rates to keep the fracture confined within the Bakken and away from the water-bearing lower formation. The production from this well is a mix of oil and water. Selection of much smaller slurry volumes is also intended to reduce fracture extension into the lower water-bearing formation. The small pad volume and relatively high proppant concentration (specially combined with such a low rate) do not usually cause screen-out or other operational problems. Optimize fracturing cost per unit proppant amount. As expected, the total cost, as well as the cost per ton of proppant pumped, is lower in this case, compared to either of the two examples cited earlier. DISCUSSION While it is very difficult to establish clear parameters for comparing the efficiencies of these three treatments, some possible measures are listed in Table 1. The table shows the wide range of operationally successful fracturing treatments being performed by the oil and gas industry. Note the wide range of variations in rate, total slurry volume, proppant concentration and average proppant concentration. The data in this table, together with the three charts of the treatment data, contradict some of the common beliefs of relationships between fracturing treatments, such as the percentage of fluid that should be pumped as pad volume; the relationship between rate and maximum proppant concentration; high proppant concentration causing screen-out; etc.
Interestingly, all three wells have similar production profiles, all marked by high early rates and fast decline. It is difficult to evaluate the production efficiencies of the three wells, because of the differences in reservoir characteristics, and other factors, as presented in the following discussion. Influence of fracture spacing. The average spacing between different fractures was approximately 310 ft (Case 1), 550 ft (Case 2) and 250 ft (Case 3). Although one would expect the shorter spacing to cause higher early time production and faster decline, the production data did not support this expectation. This could be because of large differences in other fracture parameters, such as length of the fracture, amount of injected proppant, and the influence of fractures on the production profile. Fracture spacing in other completion systems can be much shorter than examples cited here. The author is aware of fractures, spaced as short as 35 ft, in a plug-and-perf fracturing system. Production logs from some horizontal wells have shown large variations between contributions of individual fractures, with most of the production coming from only a few of the fractures. Whether this is caused by production interference between fractures, differences between individual fracture characteristics, or reservoir heterogeneity is still an open question. But it raises the possibility that it may be possible to achieve the same well productivity with smaller numbers of fractures and lower costs. Wellbore spacing. In recent years, the distance between adjacent horizontal wells has been declining gradually. One reason for this decline is the more frequent use of pad drilling, where multiple wells are drilled from a single pad. The operational and cost efficiencies offered through pad drilling allow an increase in the number of wells (with reduced spacing) at lower incremental costs. However, one of the consequences of reduced well spacing has been frequent well-to-well communication during hydraulic fracturing, especially since most operators make every effort to create transverse hydraulic fractures (i.e., fracture orientation perpendicular to wellbore direction). As a result, many U.S. operators have adopted the policy of closing offset wells during fracturing operations. In Canada, in the province of Alberta, ERCB regulations mandate closing of the adjacent wells and recording their pressure changes during fracturing operations. Inter-well pressure communication has been observed between wells more than 0.5 mi apart. In some cases, fracturing fluid and proppant have been recovered or produced from the offset wells. Pressure data recorded during the fracturing treatment often indicate closure of the connection shortly after the end of pumping. Short-term production analysis may also indicate an absence of production interference between wells. However, in many cases, longer-term production analysis shows clear evidence of production interference. In such cases, one can make the argument that, from a technical point of view, the combination of wellbores and fractures is excessive for efficient production of the reservoir. But would this also be true from a financial perspective? The higher early production has clear cash flow advantages. But does the added early cash flow justify the higher cost of more wells and fractures? The answer depends on the specific details of drilling and completion, as well as other costs of operations. There are cases, where most of the fractures from three to five adjacent wells had intersected at least one offset well, sometimes as many as three, or even more. Because these wells were all cased and cemented, the only evidence of fracture crossings was pressure data and “fracture shadowing”. CONCLUSIONS As a result of both close fracture and well spacing, there is technical evidence, in the form of production interference, for the argument that horizontal wells are “over-fractured.” However, the existing data are not sufficient to make a convincing case for financial “over-fracturing.” This type of analysis requires clearer, more accurate representation of the created hydraulic fractures, something that is sadly missing at the present time. For the time being, most operators seem willing to accept the incremental cost of larger-size fractures to avoid the bigger financial risk of “under-fracturing!”
|
||||||||||||||||||||||||


