JULIE PEARCE and TORY STOKES, NOV Downhole
The U.S. rig fleet experienced a year of turnarounds in 2013. According to the 60th annual NOV Rig Census, the U.S. available fleet made a U-turn, when it climbed this year after shrinking during 2012. Activity levels also went in the opposite direction; this time, however, falling back to the level seen two years ago. When rig counts were examined for the census in the early summer this year, commodity prices had not risen enough to maintain the drilling momentum experienced in the U.S. during 2012. The gap between available and active rigs widened this year, pushing down rig utilization for 2013 and showing a weakening market.
The Canadian drilling environment told a similar tale, with rig availability strengthening, while rig activity weakened. A notable number of newly-manufactured rigs helped boost Canada’s available count in 2013. However, activity during this time period was significantly lower than last year. Persistently low natural gas prices may have influenced Canadian drilling to an even greater extent.
The global offshore mobile fleet was one bright spot, showing impressive gains, again, in 2013. Even more brand new offshore units entered the worldwide fleet over the past year, and these rigs are being put to work robustly. Utilization for the global offshore mobile fleet continues to tighten.
CENSUS HIGHLIGHTS/PERFORMANCE VS. 2012
Key statistics from the 2013 census include the following:
- The U.S. fleet had an overall increase of 49 rigs, causing the total available count to rise about 2%, to 3,055. This net increase is the result of 256 rig additions and 207 rig deletions, Fig. 1.
- The number of U.S. rigs retiring, and the number of newly manufactured rigs, both fell in 2013, with rigs removed from service numbering 182 and brand new units totaling 147.
- U.S. rigs meeting the census definition of “active” fell to 2,055, down about 9%.
- Utilization of the U.S. fleet (combined land and offshore) dropped to 67% from 75% a year ago, Fig. 2.
- The total number of U.S. rig owners dropped to 313, down from 317 in 2012.
- Drilling contractors own 86% of all U.S. drilling rigs, a 1% increase this year, with operators owning the remaining 14%.
- The Canadian available rig fleet rose to 777 units, up 4% from last year.
- Canadian rig activity declined 12%, with active rigs numbering 289.
- Canadian utilization is down to 37%, compared with 44% in 2012.
- The global offshore mobile fleet’s available count came in at 850, after growing 3% in 2013.
- Global, offshore mobile activity was up 11%, with active rigs at 697 units.
- Utilization of the global offshore mobile fleet is now up to 82%, after reaching 76% last year.
- Most international regions showed declines in utilization this year, with the overall average being 85%.
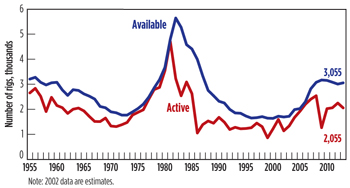 |
| Fig. 1. U.S. available vs. active rigs, 1955-2013. |
|
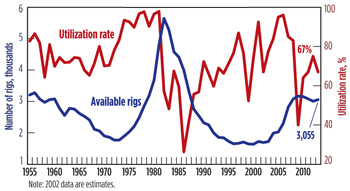 |
| Fig. 2. U.S. available rigs vs. utilization, 1955-2013. |
|
U.S. RIG ATTRITION SLOWS
Every year, when the U.S. fleet is examined for the census, rigs are deemed “unavailable” for various reasons. Units with older technology, that have been sitting idle for several years, are often no longer considered viable according to rig census rules. Rigs may be missing equipment and a stand-by crew, or would simply require a significant capital expenditure in order to be operable. Occasionally, accidents also damage rigs beyond repair, so these units can no longer be counted in the census. Rigs that have been exported to other countries for more lucrative jobs are removed from the U.S. portion of the census. Each of these cases is tallied as a reduction to the U.S. fleet. This year’s total deletions numbered 207, about a 50% drop from last year’s 410-unit reduction. As mentioned, deletions to the fleet are categorized three ways, Table 1:
- Rigs removed from service
- Rigs moved out of the country
- Rigs destroyed.
| Table 1. Changes in the available U.S. fleet. |
|

|
Rigs in the “Removed from Service” category continue to be the largest group of deletions, but the number has declined significantly during 2013. Just 182 units were decommissioned in 2013, versus 386 last year. Included in this category are any units that require a large capital outlay to be operable; have been auctioned for parts or cannibalized to keep other rigs running; or have been stacked for a long period of time. Note that some of these older rigs may be refurbished later and brought back into service, if drilling conditions justify the expense. In that case, they are added back to the available fleet during a future census. A number of these reactivations happen every year, and these rigs are mentioned in the “Additions” part of this article. However, as the U.S. fleet continues its transformation, with many brand-new units coming online, the need for these refurbished units may be diminishing.
Depending on the current market situation, companies sometimes move their rigs into and out of the U.S., and these rig movements are tracked in the census. In this year’s count, 22 rigs moved out of the U.S., similar to the 23 units that were exported in 2012. The destinations of these rigs are not always known, but Mexico appeared to be the targeted country of more than a third of the relocations this year. Rig movement into the U.S. is covered in the section below.
Rigs that were destroyed beyond repair are in the final deletions category. Three rigs were reported to have sustained significant damage in the 2013 census. Two of these rigs were known to have burned, but specific information was not provided for the other unit. This compares to only one rig that was counted as destroyed in the 2012 census.
U.S. RIG ADDITIONS DECLINE FROM RECENT PEAK
Rig expansion programs are still continuing, although new units aren’t coming online at the same rate that they did last year. Refurbishing older units or assembling new rigs from used components can sometimes be a cost-effective way to bring units to market. Typically, some rigs are also imported into the U.S. from other countries. Census figures show that the U.S. fleet added 256 rigs, overall, during the past year, down 24% from the 335 added in 2012. Although rig additions dropped significantly, these 256 units still offset the 207 deletions mentioned previously. Fleet additions fall into one of four categories, Table 1:
- Newly manufactured rigs
- Rigs brought back into service
- Rigs moved into the country
- Rigs assembled from parts.
Although newly manufactured units experienced a downturn in 2013, there are still a copius number of new rigs being produced, and the average age of rigs in the U.S. fleet continues to decline. Cumulatively, over the past eight years, 1,685 brand-new units have been added to the U.S. fleet, indicating that at least 55% of the fleet has the advantage of newer technology and, presumably, lower maintenance costs. Of those 1,685 rigs, 147 were added during this year’s census. This is a drop, compared with the spike that occurred in new additions last year, when 223 were added.
The number of U.S. rigs that were “brought back into service” during 2013 has essentially been flat for the last several years. This year’s number came in at 97 units, versus 94 in 2012 and 95 in 2011. Each of the rigs that was reactivated had been counted previously in a prior census but had been removed, due to inactivity or inoperability. Many of these 97 reactivations were most likely refurbished units, and are being counted again as part of the U.S. available fleet.
Also cited in the annual census are rigs that moved into the U.S. during the past year. Nine rigs were noted as being brought into the U.S. since last year’s census. This is down from the 12 rigs that moved into the country during 2012. With 22 rigs moving out of the country and just 9 moving in, a net decline of 13 units was counted. For about the past decade, more rigs have been tracked as leaving the U.S. than as entering. These differences are often small, but they may reflect drilling regulations in the U.S. that are more heavy-handed than in other countries.
Lastly, three rigs assembled from component parts were added to the fleet in 2013, half of last year’s six. This is a number that is difficult to quantify, since there is often a fine line between refurbishments and new assemblies. This is especially the case, when rigs have new owners and are, therefore, subsequently renamed. Although we suspect that there may be more units that could be classified in this category, it is clear that, in recent years, many more rigs have been newly manufactured or refurbished than have been assembled from component parts.
Total rig additions numbered 256, while deletions totaled 207. The net change in the fleet over the past year was a 49-unit gain, up about 2%. This is compared with a fleet decline of 2% in 2012. Less dramatic changes in some of the specific rig additions and deletions categories for 2013 indicate a moderately stable U.S. rig fleet, Fig. 3.
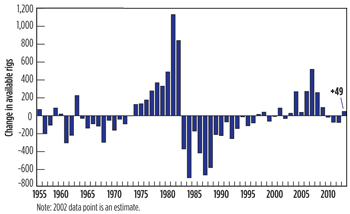 |
| Fig. 3. U.S. change in available rigs, 1956-2013. |
|
CANADIAN FLEET ADDS RIGS WHILE ACTIVITY FALLS
The Canadian “available” fleet has made a slight recovery this year, after it began experiencing declines back in 2009. A significant number of rigs continue to be dropped from the Canadian census, as they are removed from service and moved out of the country, but a larger number than usual were also added to the fleet in 2013.
The principal cause of Canadian fleet attrition continues to be rigs “removed from service,” such as those that have been idle for a long period of time or require a large capital expenditure to be put back to work. Data gathered about these units indicated that 52 were no longer considered operational. This is less than the 67 rigs removed in 2012. Twenty-one rigs were also taken out of the census in 2013, due to their movement out of Canada. This was a decline, compared with the 33 rigs that were relocated to other countries last year. Almost all of these rigs were land rigs bound for the U.S. market. No Canadian units were reported as destroyed over the past year. The sum of all deletions totaled 73 units in 2013.
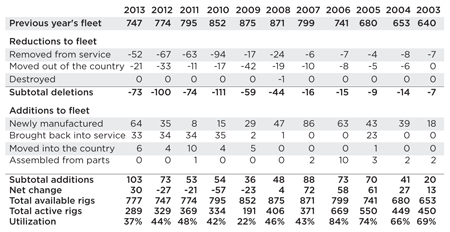
Manufacturing of newbuilds increases. The number of newly manufactured rigs entering the Canadian fleet had declined for several years, but it has seen a significant resurgence for the past two years. For 2013, the number of rigs built from scratch numbered 64. This was a further increase from the 35 new units added in 2012. Reactivated rigs have been staying at about the same level for the past four years, with 33 added over the past year. There were also six units that moved into the country for 2013. This makes the net decline in imports/exports 15 units after considering the 21 rigs that moved out of Canada. No units were indicated as assembled from component parts. Total rig additions came to 103 units, overall, for Canada, 30 units higher than last year. This year was certainly a flip-flop year for additions versus deletions, with the statistics reversing themselves when compared with 2012. Additions have now overcome deletions, and the available count rose 30 units, or 4%, to 777, Table 2.
| Table 2. Changes to the Canadian rig fleet. |
|
|
GLOBAL OFFSHORE MOBILE FLEET EXPANDS
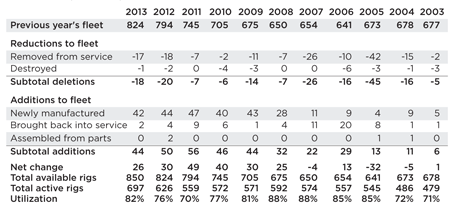
Rig-building in the offshore arena continues to expand the global offshore mobile fleet. Another 42 brand-new rigs came online over the past year and were counted in the 2013 census. For the past five years, at least 40 new units per year have been added to the fleet. In addition to these newbuilds, two offshore rigs were also brought back into service. No units were added after being assembled from component parts. IHS Petrodata, which provided most of the offshore census data, reports that another 83 units are scheduled for worldwide delivery by the end of the 2014 census, which will be taken late next spring. Even though all of these rigs will not meet that schedule, another strong year of fleet additions is likely, possibly topping the number of brand-new units seen this year.
The global offshore mobile fleet experienced slightly lower attrition this year. This includes 17 rigs that have been retired from service, some of which are undergoing conversions to non-drilling. This is about the same number counted as last year, when 18 rigs were removed from the fleet. One offshore unit was reported as destroyed, Table 3. Note that if an offshore rig has not worked for more than five years, and does not have upcoming contracts, it is generally not classified as available. This is to prevent rigs that require significant capital or maintenance expenses from being counted, since they cannot be reactivated quickly. Although these drilling units are excluded from the current census, it is not uncommon for some to re-enter the fleet at a later time, if market conditions warrant. Note that although the U.S. census is able to track the majority of platform and inland barge rigs in the country, the global mobile offshore statistics do not reflect these units, since the worldwide statistics are particularly difficult to obtain.
| Table 3. Changes to the global offshore mobile fleet. |
|
|
The available count for global offshore mobile units is now 850, a net increase of 26 rigs. This is a 3% increase from the 824 rigs in the last census. The worldwide, offshore mobile fleet is widely distributed, with the Middle East in the lead, followed closely by Southeast Asia, South America and the U.S., Fig. 4. The fleet composition by specific rig type is shown in Fig. 5.
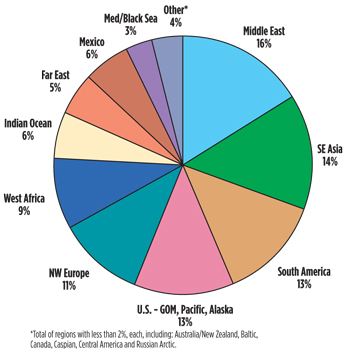 |
| Fig. 4. 2013 Global offshore mobile fleet, by region. |
|
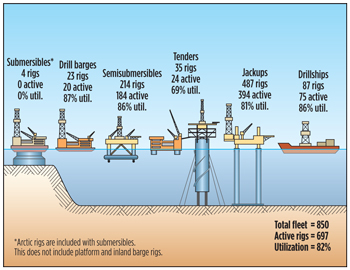 |
| Fig. 5. Makeup of the Global Offshore Mobile Fleet. |
|
U.S. ACTIVITY SLOWS
After showing increasing strength for the past several years, U.S. drilling activity has slowed in 2013. The active count fell about 9%, back to its level of two years ago. Active rigs numbered 2,055 for 2013, versus 2,248 in 2012. However, since available rigs rose a bit this year, the gap between supply and demand has widened, indicating a weakened drilling market.
The methodology used to count active rigs for the NOV census is different from other quoted rig counts. This census counts a rig as active if it has “turned to the right” at any time during a defined 45-day period in the late spring. This year, the census active period was between May 8 and June 21. Other published active counts typically report much shorter windows of activity, such as a week. When a longer period is used to monitor activity, a larger pool of working rigs will be counted, and the count will be higher.
An often-quoted industry statistic is rig utilization, the ratio of active to available rigs. This number gives a snapshot of the demand/supply balance at a particular time. If the utilization percentage falls, it can indicate a less healthy industry. This year, U.S. utilization has fallen and is now just 67%, versus last year’s 75%. This is a return to the level seen in 2011. This year’s decline pulls the statistic to below the 60-year historical average of 74%.
Variables affecting active status. There were 1,000 available U.S. rigs that were not “turning to the right” during this year’s 45-day census period. These units may have been idle for various reasons, such as being moved to their next drilling location or lacking a contract. However, they were still counted as viable drilling rigs, based on rig census rules. These inactive rigs were classified, according to the length of time that they have been idle. Rigs stacked less than one year numbered 730; one to two years, 192; and two to three years, 78.
Census rules state that any land rig stacked for longer than three years will be removed from the available fleet. However, rigs are often retired before their stacked status targets them for deletion. Rigs that are removed from the fleet, because they are no longer economically viable, fall into the category “removed from service.” Assuming that market conditions do not improve over the next year, a significant number of the 78 rigs stacked for more than two years will probably leave the census in 2014.
Full-year utilization is another figure used to gauge overall fleet dynamics. This utilization is the total percentage of available rigs that drilled at any time during the past year, not just during the 45-day active window. Adding the 2,055 active rigs to the 730 rigs stacked less than one year provides the total number of rigs that drilled sometime during the past year. This full-year utilization figure indicates that rig owners used 2,785 units, or 91% of all available rigs. This compares with 2,773 units, or 92%, used in 2012, a rather insignificant difference from year to year.
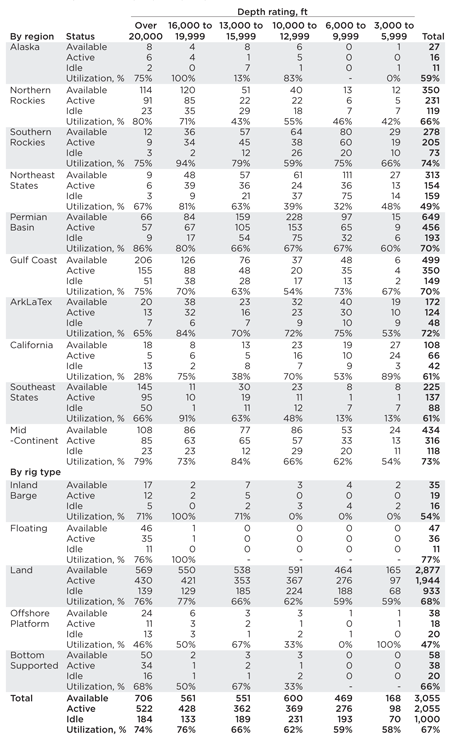
Regional results usually differ, based on the market conditions in various parts of the country. For 2013, eight out of 10 U.S. regions experienced declines in rig activity. The regional breakdown, which compares this year’s numbers to 2012, is shown in Table 4. The two regions that had slight increases in activity were Alaska and the Gulf Coast. Notable declines happened in the Northeast states and the ArkLaTex region. The Northeast states were down about 19% in rig activity for 2013. The rig count in the ArkLaTex region fell another 18%, and now has an active count of just 151. Both of these areas experienced significant declines last year, as well.
| Table 4. U.S. regional census results. |
|

|
Utilization by region also shows mixed results, with most areas going down while just two went up, ArkLaTex and the Southeast states. This year’s utilization figures for each region are as follows:
- Alaska, 59%
- Northern Rockies, 66%
- Southern Rockies, 74%
- Northeast states, 49%
- Permian basin, 70%
- Gulf Coast, 70%
- ArkLaTex, 72%
- California, 61%
- Southeast states, 61%, and
- Mid-Continent, 73%.
The previous regional figures are a combination of land and offshore statistics, but looking at just the U.S. land rigs in total, gross utilization was 68%. This is a reduction from the 76% rate in 2013. The U.S. marine fleet, however, experienced a 10-percentage-point boost in utilization, up to 62% for 2013. Demand varies significantly by rig type, with floating rigs being in greatest demand at 77%, and offshore platform rigs having the lowest utilization at just 47%.
When the total U.S. rig fleet, both land and offshore, is analyzed by depth capacity, differences emerge between rigs at various depth ranges. The rigs with the highest utilization, 76%, continue to be those in the 16,000-to-19,999-ft range. Those with the lowest were the most shallow (3,000 to 5,999 ft), with a utilization of 58%. Rigs in both the 16,000-to-19,999 range and those in the 13,000-to-15,999 range had the largest declines this year, each dropping 13 percentage points. Even though some of the deepest units haven’t fallen in utilization, there still appears to be excess capacity in the market for rigs of all depths. Some of these units just may not be in the right place at the right time, Table 5.
| Table 5. U.S. rig utilization by depth capacity. |
|
|
CANADIAN ACTIVITY FALLS AS GAS DRILLING LAGS
Canada experienced another decline in rig activity over the past year. For several years, Canada had shown volatility, but recently it had stabilized somewhat, and activity numbers had remained in the mid-300s. However, the active count this year fell below 300 and is now at 289, down about 12%. With available rigs on the rise and active rigs on the decline, Canadian utilization fell to 37%. Swings in Canadian utilization over the past several years have been noteworthy, with a low of 22% in 2009, just a few years after a high of 84% in 2006. The timing of the spring thaw sometimes influences the figures, since the census is taken every year in the late spring, Fig. 6.
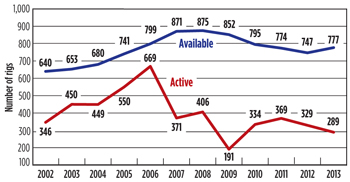 |
| Fig. 6. Canadian available vs. active rigs, 2002-2013. |
|
Subdividing the fleet, more than 60% of all rigs in Canada have drilling capacities in the 10,000- and 16,000-ft range. Fleet utilization by depth capacity shows that demand is now greatest for the deepest units (>20,000 ft), at 71%, although there are very few rigs in this category. The lowest utilization is for the shallowest rigs (3,000 to 5,999 ft) at 32%.
INTERNATIONAL RIG UTILIZATION FALLS
Rig utilization for the primary international areas has been calculated for the past seven years. For 2013, almost all areas showed lower utilization figures. Weakening markets were seen in some regions, but others experienced active count increases. We do know that high oil prices helped drive up activity in the Middle East and Africa. However, improved sources for data this year have helped the U.S. achieve greater accuracy in counting idle rigs. Therefore, utilization figures for most areas fell for this reason.
Asia defies the global trend. The one exception was Asia, which includes China, where data are especially difficult to obtain. There were small increases in rig counts in Australia and Thailand, but these were offset by reductions in Indonesia and Vietnam. In addition, companies in Asia are looking for offshore rigs on short-to-medium-term contracts, but few are available. In Latin America, Brazil has decreased its drilling activity considerably, due to economic and political issues, and the focus has changed to oil production instead of drilling. There has been some rig activity growth in other Latin American countries, driven by local necessity to increase gas and oil production, and compensate the existing importation.
It is known that some international areas have large numbers of available rigs, but these units often are saddled with older technology and may not be universally mobile or marketable. Also, in some cases, available rigs are actually under contract awaiting a project start, and are, therefore, unavailable for other work, Table 6.
| Table 6. International rig utilization. |
|

|
OFFSHORE FLEET ACTIVITY CONTINUES TO CLIMB
During the census active period for 2013 (May 8 to June 21), the global offshore mobile fleet showed another considerable jump in activity, and the active count reached almost 700 units. Total working rigs came in at 697, an increase of 11%. This is the highest number of active rigs recorded in the census, since the global offshore mobile fleet numbers started being included in 2001. This compares to an active count of 626 in 2012. All offshore mobile units, with the exception of platform and inland barge rigs, are included in these statistics. With active rigs climbing to a greater degree than available rigs, utilization was pushed up again in 2013. Utilization now stands at a strong 82% for the offshore mobile fleet, Fig. 7.
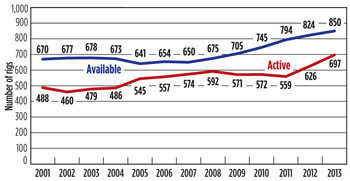 |
| Fig. 7. Global offshore mobile available vs. active rigs, 2001-2013. |
|
U.S. INDUSTRY OWNERSHIP TRENDS
In addition to looking at rig statistics, the census also counts the number of rig owners. After experiencing increases since 2003, the number of rig owners has essentially leveled for the last few years, with the number of new drilling companies being added balancing closely with the number of companies ceasing operations. For 2013, the net number of rig owners declined again slightly, by four companies, to 313, Fig. 8.
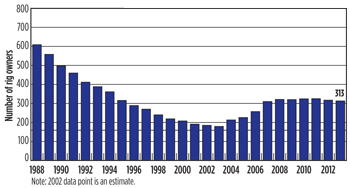 |
| Fig. 8. U.S. rig owners, 1988-2013. |
|
Drilling contractors have always owned considerably more drilling rigs than operators, although the percentage of operator-owned rigs has inched up over the years. For the past two years, the split has remained about the same, with this year showing a very slight increase in drilling contractor-owned units. Contractors now own 2,625 rigs or 86% of the fleet, while operators own the remaining 430 units, or 14% of the fleet.
Another way to observe rig ownership in the U.S. is by examining the fleet sizes of individual companies. These statistics have been compared since 1993, when consolidation was on the upswing. The larger companies (those with more than 20 rigs) continue to hold the largest percentage of the fleet, this year about 59%, up two percentage points from last year.
CONTRACTORS CONCERNED ABOUT RIG RATES
NOV sends out an annual survey to drilling contractors, inviting them to share information about their current business environment and their opinions regarding the state of the industry. The 2013 survey was completed by 63 contractors, or about 20% of all U.S. rig owners. These contractors come from a wide variety of company sizes and regional areas.
The rig owners are asked every year to rank a list of eight key issues that are typically of concern. Three issues continue to surface as the top concerns of contractors in recent years. “Rig Rates” was the Number one problem in 2013, coming to the top after being second last year. It is not surprising, that this would be a matter of importance, since rig activity is down, and the demand/supply balance of rigs is less favorable. The second highest problem this year is “government regulation.” This was the third issue in 2012. There is often apprehension about the effect that existing and new governmental directives will have on business. This has especially been the case with new issues, such as hydraulic fracturing. “Crew Availability” was the third concern this year, after falling from the top position in 2012. It is still a challenge to find, train and retain qualified personnel. However, this may have dropped a little in importance this year, due to slightly lesser demand for crews in areas where rig activity is down, Fig. 9.
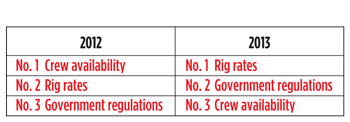 |
| Fig. 9. Top contractor concerns. |
|
Respondents are also asked to share some of their company’s current business data. Labor rates, on average, have gone up another 5% over the past year. This is a figure that continues to rise and is tied to contractors’ concerns about crew availability and, also, the skyrocketing costs of insurance and other benefits. Another increasing expense for contractors is that of equipment repair and maintenance. As rigs age, repair costs can become burdensome and cause a company to retire units in favor of updated or brand-new equipment. On average, contractors will spend 7% more for maintenance this year than they did in 2012.
Contractors responding to the survey indicated that their rig activity has gone down 13%, on average, compared to a year ago. This estimated percentage is somewhat higher than the 9% drop measured in the census this year. Regarding rig rates, U.S. respondents say that their land rates, on average, are about 2% lower than last year. The depressed market this year has held rates down a little, and, unfortunately, most contractors indicate that they are not expecting activity levels to go up by 2014.
A new question was added to the survey last year, which asked contractors to tell us what new products or service developments might impact them most during the next two years. Answers varied widely, but several respondents mentioned top drive technology. Others pointed to the progress being made in rig automation. A few owners thought that horizontal drilling technology was also going to become increasingly important to their business. Contractors were also encouraged to reveal the greatest business challenge that they may be facing during the next two years. Answers were mixed as well, but some of the most common answers were maintaining a qualified labor force, rig rates, and the regulatory environment. All these answers were consistent with their top three concerns mentioned previously. A few others referred to aging equipment and the cost of insurance as being problematic.
CONTRACTORS MAINTAIN THE STATUS QUO
The drilling industry has always been brimming with optimistic risk-takers. However, good business sense has dictated that contactors take a hard look at market forces and predict what’s in store for their companies in the foreseeable future. The survey asked rig owners what their companies’ plans are for the next five years. Forty percent of respondents this year told us that they have no plans for change. Thirty percent of contractors said they will be expanding their current fleets. This was essentially a turnaround from the 2012 survey, when 28% had no plans for change, and 45% expected to expand their current fleets. Fewer companies plan to diversify (14%), downsize (14%), have unknown plans (8%), are seeking merger opportunities (6%), and plan to pursue international opportunities (3%). Note that contractors were allowed to choose more than one category, so totaling these percentages will give an answer greater than 100%.
U.S. FORECAST FOR 2014
Relatively stable commodity prices should keep the industry humming along in the same general direction for 2014. Although the number of new technically-advanced rigs that roll out may taper off somewhat, new units will still continue to come online to replace older ones. NOV predicts that the available count will fall slightly by mid-2014. Furthermore, drilling levels will probably remain stagnant, as predicted by drilling contractors. This scenario will only serve to tighten the market slightly and inch up utilization levels. Although the short-term U.S. outlook may not be that encouraging, the global demand for oil and gas is known to be rising, and the technology advancements in the industry are very exciting. These factors can help us focus on the long-term outlook, which is worth hanging in for. 
|
Census ground rules
Company sales regions were used for the geographical breakdown shown in Table 4.
Contractor-owned rigs are those belonging to companies whose primary business is offering drilling contracting services.
To be considered active, a rig must be drilling at least one day during the 45-day qualification period.
Only workable rotary rigs are included; cable tool rigs are excluded.
To be considered available, a rig must be able to go to work without requiring a significant capital expenditure.
Rotary land rigs stacked for an extended period of time, typically three years or longer, are not counted as available.
A rig must be capable of, and normally employed for, drilling deeper than 3,000 ft. Therefore, some shallow drilling rigs (mostly in the Northeast) are excluded, but this is necessary to ensure well-servicing rigs are not counted.
Electric rigs include all those that transmit power from prime movers to electrically-driven equipment.
Inland barges include barge-mounted rigs that may be moved from one location to another via canal, bayou or river, and drill in sheltered inland waters. Offshore rigs include stationary platform units (both self-contained and tender-supported), bottom-supported mobile units, and floating rigs (both drillships and semisubmersibles). 
|
ACKNOWLEDGEMENT
NOV partners with several companies to pull together the industry statistics that are published in this article. IHS Drilling Data and RigData are the primary sources used for the U.S. land rig fleet and global offshore mobile fleet. Nickle’s Energy Group is the principal source for the Canadian figures. Information for some areas, particularly the international fleet, is collected and analyzed by NOV personnel. The following individuals are recognized for their specific contributions to this year’s rig census: Tom Kellock (IHS); Cliff Adams, Hazem Al Qura'an, Lucio Antoniani, Teodor Babut, Rami Bakir, Steve Berkman, Scott Brundrett, Roman Che, Leonora Compton, Claudia Cortazar, Sulimar De Rojo, Rachel Evans, Clifer Fernandez, John Gjertsen, Carlos Huerta Gonzales, Muneeb Hussain, Keith Joseph, Michael Maes, Ana Martel, John McCarthy, Jim McKenna, Cristine Mingoy, Andrey N. Mizin, Wahby Mohamed, Brandon Montagne, Amanda Parks, Blaise Pascal, Neil Riley, Michael Ropivia, Marwan Roushdy, Randy Shapland, Blair Shimbashi, Ben Solomon, Jim Steele, Brad Takenaka, Oleg Tsoy, Adriana Vizcarrondo and Karen Zapata (NOV).
|
The authors
JULIE PEARCE is the director of business and market development for NOV’s Downhole division in Houston. She began her career as a mud logger with Schlumberger 18 years ago, based in the North Sea. Previous positions include director of Training & Knowledge Management (NOV Downhole), account manager (ReedHycalog) and MWD/LWD engineer (Schlumberger). Julie received a BS degree with honors in geology from the University of Derby, UK.
TORY A. STOKES is a consultant for NOV’s Downhole division, after being employed for ReedHycalog as senior marketing analyst for eight years. She graduated with a BS degree in applied mathematics from Texas A&M University in 1985, and earned an MBA from the University of Houston in 1993.
|
|


