ARNAUD HUCK, dGB Earth Sciences, and GRAHAM HICKS, BG Group
Seismic inversion today still remains central to oil and gas exploration success, generating accurate rock property estimations and realistic geologic models of the reservoir.
Yet, whether it is pre-, post-stack or simultaneous inversion, the success of seismic inversion is fundamentally dependent on the information interpreters can provide, and whether the initial models honor the structural details within the reservoir.
Many reservoirs today, however, are based on limited information where, if no 4D logs are available, no conventional 4D inversion can be applied. These obstacles are being addressed through a unique new inversion approach, called the Hit Cube from dGB Earth Sciences.
With the Hit Cube, stochastic pseudo-well synthetics are matched to measured seismic responses, and seismic inversion can take place without known target information and the 4D difference logs.
This article looks at how this has been achieved in a North Sea field, opening the way toward a more advanced and flexible reservoir-characterization workflow.
ARTICLE OVERVIEW
A seismic reservoir characterization study was carried out on the North Sea’s Blake field, on behalf of BG Group, to map the migration of oil, gas and brine.
A baseline seismic survey from 1992 and a monitor survey from 2007 were available to help with the characterization process, but additional information on hydrocarbon movements at the wells was not available. As no 4D logs were available, it was not possible to conduct conventional 4D inversion.
The characterization process took place through pseudo-well modeling, which was performed to simulate the range of possible fluid contact movements, in terms of impedance log changes. The modeled wells were then used for a stochastic 4D impedance inversion called the Hit Cube.
In the Hit Cube, inversion stochastic pseudo-well synthetics are matched to measure seismic responses. Matching models are then averaged to yield probability volumes of relevant rock and fluid properties.
In the case of the Blake field, the inversion consisted of matching the synthetic seismic response with the actual 4D seismic (hit phase) and extracting the geology from the best fitting models. The result of the inversion was a 3D volume containing 4D impedance changes where the fluid movements could be displayed in 3D. Several probability and error grids were also generated.
TARGET FIELD AND HIT CUBE
Blake field is a North Sea oil field about 64 mi from Aberdeen, in the Outer Moray Firth. The field began producing oil in June 2001. The field, in Blocks 13/24 and 13/29b, is operated by the BG Group, with production expected to peak at around 85,000 bopd. The reservoir contains gas and oil in a thick sand interval.
4D seismic processing has been applied to the data sets and is considered of medium quality, with the 4D seismic survey undertaken to map fluid movements during production. The pre-production baseline survey dates from 1992, while the monitor survey is from 2007.
No post-production logs were available in the field. Such logs must be modeled to show the ranges of density and sonic logs depending on the saturation. This was achieved through Gassmann fluid substitution, a well-known equation for fluid substitution calculations. The subsequent pseudo-wells were used in a stochastic impedance inversion approach, called the Hit Cube.
The Hit Cube was developed by dGB Earth Sciences, a privately-owned company based in the Netherlands and a provider of open-source seismic interpretation software to the oil and gas industry. Current customers include Addax Petroleum, Anadarko, Chevron, CNOOC, Eni-Agip, Marathon, Petrobras, Petronas, Saudi Aramco, Statoil and Wintershall, among others.
dGB’s seismic interpretation solution, OpendTect, is the only available open-source seismic interpretation platform used in the industry today. It allows the visualization and interpretation of multi-volume seismic data. dGB and its partners have also developed a wide variety of commercial plug-ins relating to attribute and processing analysis, sequence stratigraphy, fluid migration, rock property predictions and velocity modeling.
The most recent plug-ins are the Hit Cube and the HorizonCube, which increases the number and density of mapped horizons, resulting in more accurate inversion results and geologically sound rock property predictions.
PSEUDO-WELL MODELING
Pseudo-wells were applied to the Blake field to overcome the lack of 4D logs, in particular 4D saturation and induced 4D impedance changes.
Wells were modeled to cover a large range of possible scenarios. The modeling featured four parameters, including the vertical change in the fluid contacts and the position of the contacts in the baseline survey. Four scenarios were modelled: gas cap expansion only; gas cap expansion and oil-water contact (OWC) rise; oil-water contact rise only; and gas cap reduction with additional oil-water contact rise.
Figure 1 shows a representation of the modeled 4D impedance changes with respect to four different parameters — n1 and n3 for gas-oil contact (GOC) and OWC movements, and n2 and n4 to model the unknown location of the contacts in the baseline survey. Therefore, the inversion will only have one fixed reference: the top of the reservoir formation. Nearly 4,000 models were generated in total, generating a database of 4D impedance difference logs in depth.
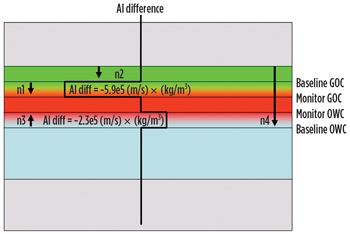 |
| Fig. 1. Representation of the modeled 4D impedance changes with respect to four different parameters—n1 and n3 for GOC and OWC movement and n2 and n4 to model the unknown location of the contacts in the baseline survey. |
|
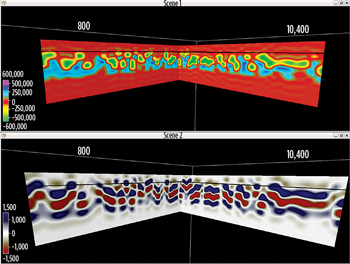 |
| Fig. 2. Modeled 4D impedance logs (top) with the corresponding 4D seismic differences (bottom). The gas cap reduction yields a decrease in AI amplitudes and appears in green. Both a gas cap expansion and an oil-water contact rise generate positive 4D impedances and appear in green-dark blue. |
|
4D synthetic seismic traces were also generated. A bulk shift of impedance was applied to the logs prior to the computation of reflectivity logs, and subsequent synthetic seismogram generation. Figure 2 shows an example of modeled 4D impedance logs (top) with the corresponding 4D seismic differences (bottom). The gas cap expansion yields a decrease in AI amplitudes and appears in green. Both a gas cap reduction and an oil-water contact rise generate positive 4D impedances and appear in green-dark blue.
HIT CUBE INVERSION
The Hit Cube approach is a 2-step stochastic inversion with the aim of converting 3D/4D seismic data into porosity, facies or 4D differences volumes without using an initial 3D model, which is often prone to errors.
Instead, the rock properties will originate from existing (if available in sufficient quantity) or modeled wells. Such wells represent the actual geology, and their number depends on the complexity of the geology. The models actually provide a link between the rock properties and seismic response. Hence, the entire waveform is used to invert the seismic back to rock properties.
In the first step, the synthetic seismic of each model was correlated to the actual seismic traces (difference between monitor and base surveys). The extraction was constrained, using thicknesses derived from the model parameters.
The thickness of the reservoir formation was used as the main parameter controlling the correlation window length, and enlarged to include the waveform at the top and base of this window. Similarity was used as the preferred correlation type, because of its scale-sensitive nature, and because amplitudes play a major role in this application, where tuning is expected.
A hit is defined when a good correlation is found between a model, represented by its synthetic seismic, and the actual data (4D seismic volume). All models with a hit are selected as possible realizations, and will contribute to the output volume and grids, and not only the best-fitting model.
The contribution scheme (Fig. 3) is such that the fit between the actual seismic and the synthetic seismic from the model provides a weight that can be used to predict the 4D impedance log. This is done by averaging the rock property logs over the fitting models.
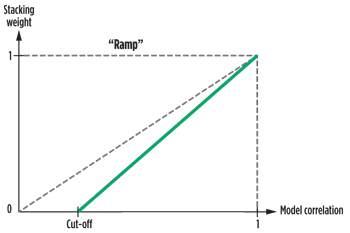 |
| Fig. 3. The fit between the actual seismic and the synthetic seismic from the model provides a weight that can be used to predict the 4D impedance log by averaging the rock property logs over the fitting models. |
|
The hit phase provided a measure of similarity between all models and each actual trace. Several grids were computed, such as the similarity between the best-fitting model at each position (Fig. 4) or the number of models above a given similarity value. The highest similarity grid shows the reservoir channel, with high similarities gathered along a southeast to northwest direction.
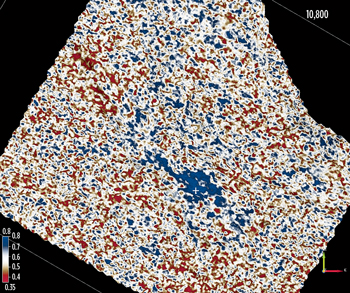 |
| Fig. 4. Several grids were computed, such as the similarity between the best-fitting model at each position. |
|
Several parameters had to be set to control the output results. The hit cut-off value controlled the number of traces to accept/reject. A low value was preferred to limit the amount of rejected traces and preserve the lateral continuity of the outputs.
The cut-off value was chosen based on this above-shown grid and after several Hit Cube runs with different parameters. Models below 45% were not put in the set of plausible realizations. The value was set at this level so that that most positions, where fluid movements were expected, would have at least several realizations.
The stacking of the realizations was also controlled by the maximum number of traces that were used for the stack. This parameter controlled the smoothness of the outputs. Low values gave an undesirable amount of noise, with high values tending to smooth the outputs too much. The standard deviation volumes and grids provide the amount of differences to be found between the models used to generate the output properties. They are formed by logs and features collected from each model. The set of realizations is used to create mean and standard deviation volumes and grids using a weighted stacking procedure.
Restrictions in the choice of the models appeared to have a great effect. Restricting the oil-water contact movement to 20 or 30 m, instead of 60 m, effectively removed a large bias in the grids, showing the mean value of the simulation parameters. The output grid, showing the mean oil-water contact position in the baseline survey, provided a good overview of the spatial confidence area.
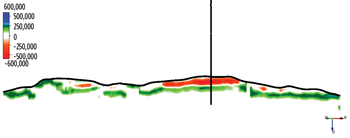 |
| Fig. 5. Adequate color coding provided a direct overview of nature, position and the amounts of movements of the fluid contact. The gas cap expansion area appears in red, the oil-water contact rise areas are shown in green, and the gas reduction areas are shown in darker green to blue (mainly eastern edge). |
|
The main output volume was the mean acoustic impedance difference, stacked using the corresponding logs from the models that were hit. Color coding (Fig. 5) provided a direct overview of nature, position and the amount of movement of the fluid contact.
The gas cap expansion area appears in red, the oil-water contact rise areas are shown in green, and the gas reduction areas are shown in darker green to blue (eastern edge mainly). The latter two features have the same polarity, a positive impedance difference, but the gas reduction generates a 25% “brighter” impedance difference than an oil-water contact rise. The ability to separate both can be regarded as an important validation criterion for the inversion.
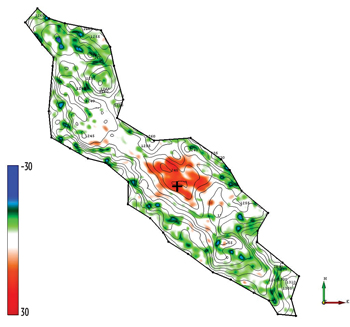 |
| Fig. 6. A map of the mean GOC movements that shows that the gas expansion area is located in, and north of, the location of the well used for the synthetic-to-seismic scaling. |
|
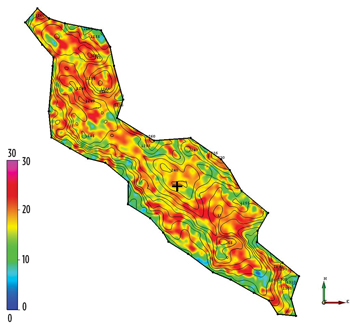 |
| Fig. 7. A map of the mean OWC movements that shows that the OWC rise is widespread, with the exception of the gas expansion area. |
|
The main results were maps of the mean GOC and OWC movements shown in Fig. 6 and Fig. 7, respectively, along a mapped reservoir channel. Probability maps of gas expansion, gas reduction and OWC rise at each location were the secondary results obtained. Those qualities were all known for each model (pseudo-well), in the original depth domain, and for each location the model parameters of the models in the hit population were stacked, similarly to the logs. Hence, standard deviation grids were also available for each feature. Figure 6 shows that the gas expansion area is located in, and north of, the location of the well used for the synthetic-to-seismic scaling.
The gas reduction areas, shown in blue and green (negative is upwards movement), occur more on the side of the channel and in the northwestern part. Figure 7 shows that the OWC rise is widespread, with the exception of the gas expansion area. The largely visible gas cap expansion around this well seems to hide the expression of the oil-water contact rise. This behavior remains to be interpreted.
CONCLUSIONS
The stochastic seismic inversion approach called Hit Cube managed to perform the seismic inversion without known target information and the 4D difference logs. Its design allows the seismic interpreter to input simple and/or complex modeled wells.
The analysis of the inversion parameters showed that a good understanding of the geology and reservoir is essential for the fine-tuning and quality control of the output volumes and grids. Several runs were performed before the most realistic were achieved. All of them contribute to the interpretation of the 4D changes in the survey. It should be acknowledged, however, that the use of unrealistic models can potentially produce unrealistic results.
The inversion on this field managed to highlight, in 3D, the fluid movements between the baseline and monitor surveys. The stochastic inversion produced not only a mean impedance difference volume, but also a number of grids as features extracted from the modeled wells.
Not all of the outputs provided target features, however. Most of these were quality control maps. Some others were best for delimiting the area of confidence for the inversion, like the mapping of the channel portion of the reservoir, which was performed using the mean difference between the baseline and monitor OWC grid.
Seismic interpretation today is all about squeezing maximum geological value out of seismic data. Hit Cube is playing a crucial role in this process, ensuring that seismic inversion can take place where previously it was not possible.
ACKNOWLEDGMENTS
The authors would like to thank BG Group, Talisman Energy (UK) and Idemitsu Petroleum UK Ltd. for the authorization to present this work. Thanks also to Bert Bril of dGB Earth Sciences for the actual implementation of the Hit Cube software.
|


