ROBERT DOWNIE, JIAN XU, DEE GRANT, RAJ MALPANI and ANUP VISWANATHAN, Schlumberger
The goal of the engineering evaluation of microseismic events is to identify variations in the microseismic response and provide an interpretation that proposes an explanation of the observed behavior, using all of the information available for the evaluation. In some cases, it is possible to extend the evaluation of microseismic data to production evaluation and completion design. This task is made more difficult by the fact that the microseismic measurement itself is known to be variable and can be affected by a variety of factors, which are implicit to the methods used to detect and locate microseismic events.1
The two most common factors that affect evaluation of microseismic data, acquired using geophones deployed in wellbores adjacent to the stimulation activity, are location uncertainty and monitor well bias.
Data assurance and conditioning procedures that minimize location uncertainty should be applied to the data prior to beginning the engineering evaluation.2
Differences in the ability to detect and locate microseismic events at various distances when geophones are placed in offset wellbores can also affect the evaluation. As the distance between the monitoring array and the location of microseismic activity increases, the minimum detectable wave amplitude at the source location increases. Signals with amplitudes below this minimum are attenuated below the level of detectability as the wave is transmitted through the rock to the geophones. The most noticeable effect is a decrease in the numbers of located events, as distance increases. The relationship between distance and detection is referred to as monitor well bias.
In some cases, it is not possible to extract the desired information required for the engineering evaluation of the microseismic data using only event locations (hypocenters) and times. Interpretations of the microseismic response, based on the event locations and times, might be misleading. Additional information can be obtained through analysis of the source parameters of the microseismic events, which might be useful in the evaluation and interpretation of the observed microseismic responses.
MICROSEISMIC EVENT SOURCE PARAMETERS
Microseismic events are produced during fracturing when fluid pressure causes mechanical failures within the reservoir and surrounding formations. The deformation consists of slip of unknown length, along a failure plane of unknown area and orientation. The deformation produces shear and compressional waveforms used to locate the hypocenter of the microseismic event.3 Source parameters describing size, orientation and other characteristics of the failure that produced the microseismic event can also be derived from detected waveforms.
Determination of the many source parameters to characterize the failure that produced the microseismic event depends on the number of separate monitoring locations. However, even with a single geophone location, the most common configuration for borehole-based microseismic monitoring, information can be derived related to the size and intensity of the energy release that occurred. This parameter is known as the seismic moment.
The same process used by earthquake seismologists to compare the size and intensity of seismic events is used to compare the source characteristics of microseismic events. The amplitudes and frequency content of the detected microseismic events are used to estimate the seismic moment of the deformation. Seismic moment values are then converted to equivalent moment-magnitudes, hereafter referred to as event magnitudes. Magnitude values are used to characterize monitor well bias, using a magnitude versus distance plot, and provide a means to qualitatively compare the relative “strength” of the microseismic events. Moment and moment-magnitude are therefore different expressions of the same measurement.4 The scalar moment values can be computed using a single geophone array through this process.
Moment (Mo) can be expressed mathematically as the product of shear modulus (G), failure area (A), and displacement (û), as shown in Equation 1. The units are the product of force and distance, i.e. lb-ft or N-m.
Mo = G × A × û (1)
[F × L = F/L2 × L2 × L]
Differences in the areas of the failures and associated displacements are the source of the majority of the variability observed in the computed microseismic event source parameters. Although the areas and displacements cannot be separated mathematically, the product of the two terms is the deformation of interest for the evaluation of fracture response. The deformations occur as a direct result of the fracturing operations; therefore it should be possible to use the moment values to determine when, where and at what rate deformation takes place during a stimulation treatment.
APPLICATIONS OF SEISMIC MOMENT
Scalar moment values can be used to quantify microseismic responses observed during hydraulic fracturing treatments. Moment values are preferred since their conversion to moment-magnitude includes a logarithmic function.
The arithmetic sum of moment values is easily obtained and is referred to as cumulative moment. Cumulative moment then is an expression of the total deformation observed during a fracturing treatment, through microseismic monitoring.
The application of cumulative moment extends the ability to evaluate microseismic data beyond qualitative comparisons of the dimensions and volumes of the event clouds through several techniques:
- Evaluation of cumulative moment as function of time for comparison to stimulation treatment data and analysis of time-dependent fracturing response
- Evaluation of cumulative moment as a function of spatial dimensions such as depth
- Calculation of the total deformation observed within a defined volume of rock for temporal and spatial evaluation
The advantage of cumulative seismic moment is that changes in microseismic response can be more easily identified when compared to common evaluation tools such as the dimensions of the microseismic event clouds or the microseismic volumes, commonly referred to as Stimulated Reservoir Volume or SRV.5 Microseismic dimensions often lack the resolution to identify all but the most obvious changes in the microseismic response. Microseismic volume estimates are heavily dependent upon both the numbers of events detected and their proximity to one another, and are therefore highly susceptible to monitor well bias. Neither method includes any direct compensation for variations in the source parameters and gives equal weighting to all the events used in the evaluation.
Monitor well bias can potentially influence the evaluation of the observed microseismic activity. It is not simply that events created by relatively small deformations become less detectable with distance. Such events occur in much greater numbers than the larger deformations that are more likely to be detected within the monitored volume.6 Seismic moment values provide a means to compensate for this behavior and greatly reduce the potential impact of monitor well bias on evaluation results.
The relationship between moment and moment-magnitude is such that each unit of increase in the magnitude, for example from –3 to –2, is equivalent to approximately a 32-fold increase in the equivalent moment. The relative increase of the moment over two decades of magnitude is, therefore, almost 1,000 times.
The relationship is beneficial for evaluation. Microseismic events at the lower range of event magnitudes, usually observed during microseismic monitoring projects and the most susceptible to monitor well bias, have very low moment values. Moment values of events with higher magnitudes, that have a much higher probability of being detected, are exponentially larger. Effects of monitor well bias that might be present are minimized when moment values are totaled to produce a cumulative moment for comparison and evaluation of microseismic response. The presence of low-magnitude microseismic events in cumulative moment comparisons introduces very little error to the evaluation, compared to other techniques.
Temporal behavior of the cumulative moment response can be compared for multiple stimulation treatments within a project, to determine if there are variations in microseismic response.
CASE HISTORY: EAGLE FORD EVALUATION
The following case history demonstrates that cumulative moment applications can be used to develop an interpretation of fracture behavior that could not be made using evaluations based only on the event locations, event times and microseismic volumes.
A well was initially landed in the Upper Eagle Ford, and then steered downward through the vertical section into the Lower Eagle Ford. The completion design called for a series of hydraulic fractures initiated along the length of the lateral, to observe any changes in fracture geometry at different locations within the vertical section. The same stimulation treatment design was used for all stages of the completion.
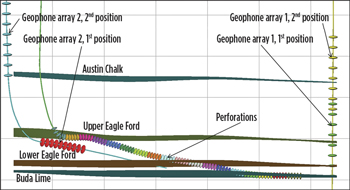 |
| Fig. 1. Microseismic monitoring configuration, well path and proposed completion. |
|
Two monitoring wells were used to detect and locate microseismic events during the project, Fig. 1. The monitoring tools were moved during the completion to optimize event detection and minimize monitoring distances. Events that were detected by both geophone arrays were co-located, so that only one event location was displayed when the events were detected by both monitoring arrays.
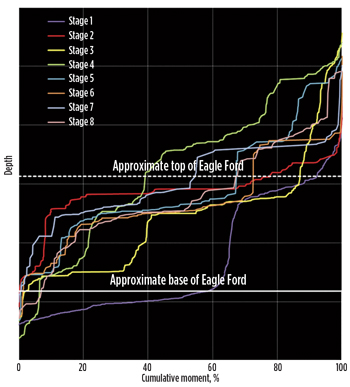 |
| Fig. 2. Deformation vs. depth in the Lower Eagle Ford. |
|
An alternate method of evaluation, based on the source parameters of the microseismic events, was employed to evaluate the microseismic events. Cumulative moment versus depth was plotted for each of the stimulation treatments to determine if fracture behavior was in fact consistent regardless of the landing point of the well within the vertical section, or if changes in the location and rate of deformation occurred during the completion that could be attributed to the location of the well relative to the various formation tops.
The result of this analysis for fractures, initiated in the Lower Eagle Ford, is shown in Fig. 2. The data shows that fracturing treatments initiated in the Lower Eagle Ford produce most of the observed deformation within the Upper and Lower Eagle Ford layers. The distribution versus depth also shows that there is considerable variability in the microseismic response, from one treatment stage to the next. The cumulative moment versus depth plots have been presented using the non-dimensional format, based on percentage of the total deformation observed during each stimulation treatment.
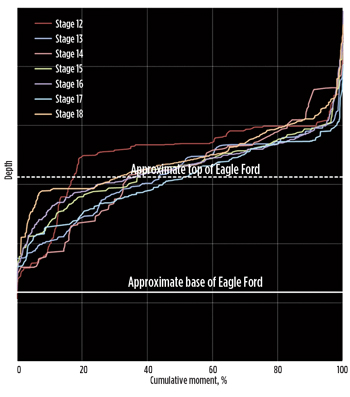 |
| Fig. 3. Deformation vs. depth in the Upper Eagle Ford. |
|
Evaluation of fracture treatments initiated in the Upper Eagle Ford is shown in Fig. 3. A much higher percentage of deformation takes place above the Eagle Ford, in the Austin Chalk. The distribution of deformation with depth is more consistent from stage to stage, compared to fractures initiated in the Lower Eagle Ford.
Fractures initiated in the Lower Eagle Ford have better height containment within the Eagle Ford, although some activity is noted during most stages in the Austin Chalk. The fractures were also assumed to have a higher level of network complexity, based on the variability of the observed deformations, compared to the treatments that were initiated in the Upper Eagle Ford. This interpretation indicates that any attempt to model the hydraulic fractures must incorporate changes in stress profile, rock fabric, and other reservoir and geomechanical properties that affect the observed fracture behavior.
INTEGRATION OF RESULTS /CALIBRATION OF A MODEL
Microseismic monitoring of hydraulic fractures in horizontal wells of unconventional reservoirs has shown that the fractures are influenced by factors not easily incorporated into conventional hydraulic fracture models. Evaluation of the microseismic data provides insights into important aspects of horizontal well completions, such as spacing between laterals, the number of treatments required to complete a horizontal well, and spacing between treatments. It does not allow direct evaluation of proppant placement or conductivity within the fracture. It is not possible, in the vast majority of cases, to determine the optimal fluid and proppant volumes directly from microseismic measurements alone.7
Development of complex hydraulic fracture models, for unconventional reservoirs, allows the comparison of modeling results to microseismic measurements.8 It has been very difficult to match complex fracture modeling output to the microseismic data, when multiple treatments in the same well are included in the modeling. Such difficulties are often the result of inadequate compensation for location uncertainty and monitor well bias. However, important observations of the microseismic response necessary for both the calibration of the model and validation of the modeling output often cannot be identified from the visualizations of event locations and times.
Deformation interpreted from the seismic moment of the events and cumulative moment responses provide an alternate means to compare modeling results to the observed deformations. Mapping the observed deformations, within a three-dimensional geological model that has been developed for the complex fracture modeling, allows direct comparison of microseismic responses to the modeled fracture geometry.
The steps required to visualize the deformation include the creation of a 3-dimensional grid that surrounds the volume of rock where microseismic activity has been observed, mapping the moment values of the microseismic events into that grid, and setting the display parameters so that the visualization of deformation is distinct, and differences in total deformation can be observed. The moment values of any events located within a grid cell are totaled when the grid is populated with the events. This process results in a three-dimensional visualization of the deformation during the stimulation treatment, which can be compared to the output of the fracture model. This workflow can be performed using the events from a single stimulation treatment, or all of the events detected during a microseismic monitoring project.
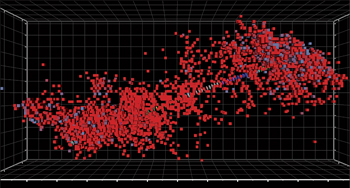 |
| Fig. 4. Three dimensional deformation map based on cumulative seismic moment |
|
The deformation map is shown in Fig. 4. Grid cells with low total deformation have been disabled to improve the visualization. Changes in fracture geometry that occur during the completion are easily identified and reveal differences in fracture geometry. Fractures initiated in the Lower Eagle Ford are longer and appear to be more complex than the fractures in the Upper Eagle Ford. Fractures initiated in the Upper Eagle Ford have more deformation closer in the wellbore and increased deformation in the Austin Chalk.
Calibration of the complex fracture model is based on deformation maps developed from the microseismic data from individual stimulation treatments. A common geological and geomechanical model is used throughout the evaluation. Selected stimulation treatments that represent various landing points within the Eagle Ford are modeled and compared to the mapping of the observed deformations. Adjustments to the modeling parameters are applied and compared to the deformation maps, to get the best overall agreement between the modeled fracture geometries and the observed deformations for all of the stimulation treatments selected for the calibration.
There is no intent in the modeling to perfectly match each individual stimulation treatment with the microseismic event locations. Instead, a set of modeling parameters is developed that yields results consistent with the microseismic interpretation to as large an extent as possible along the length of the lateral. Development of a single set of modeling parameters that is valid for all landing points within the vertical section, enables forward-modeling of alternative hydraulic fracture treatment designs.
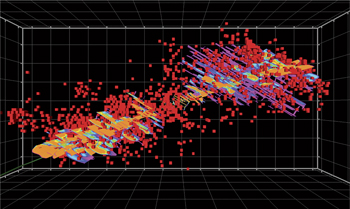 |
| Fig. 5. Composite deformation map and modeled fracture geometries. |
|
The final step is to compare modeled fracture geometries for all of stimulation treatments to the complete set of the microseismic data. In Fig. 5, all 18 treatments have been modeled and compared to the deformation map shown in Fig. 4. Throughout the data set there is agreement between modeled fracture geometries and observed deformations both laterally and vertically.
Cumulative moment analysis shows significant differences in microseismic response, and that the modeled complex fractures are consistent with those responses to an acceptable degree of accuracy, after calibration of the complex fracture model.
RESULTS AND CONCLUSIONS
Microseismic monitoring of hydraulic fractures is one of the very few methods available to determine how reservoir rocks and bounding formations respond to fracture stimulation treatments. The use of seismic moment and its relationship to the deformations that produce microseismic events enhances the ability to interpret microseismic data from hydraulic fracture monitoring projects. Variations in microseismic response that are difficult or impossible to recognize through visualization of the event locations or through the use of qualitative measurements such as microseismic dimensions and volumes can be identified through evaluations of deformation using cumulative moment. Sensitivity to observation bias is greatly reduced and the influence of outlier events that define the limits of the event clouds can be evaluated objectively.
Cumulative moment permits comparisons of the time-dependent microseismic response to the stimulation treatment data. Multiple treatments can be compared to determine if the microseismic response is consistent, changes as adjustments are made to the pumping schedule, or changes due to other influences such as differences in the landing point of the well. Evaluating deformation versus depth allows a more quantitative assessment of height growth into bounding formations than use of visualizations of event locations and estimates of fracture dimensions taken from event locations.
Mapping deformations spatially enables direct visual comparison of microseismic response to the output of a complex hydraulic fracture model. The ability to display the deformation map simultaneously, with the modeling results, provides direct feedback to determine if the model has been calibrated adequately. Calibration of the model is based on comparing modeled geometry to distribution of the observed deformations.
The objective to develop a common set of modeling parameters that provide reasonable results in a complex fracture model, for a variety of landing points within the Eagle Ford formation, has been achieved. This generalized set of parameters can be used for forward-modeling of future completions and to evaluate the effects of alternative stimulation treatment designs, in hydraulic fracture monitoring to production simulation workflow. 
ACKNOWLEDGMENTS
The authors express their gratitude to the management and staff of Lewis Petro Properties and BP Americas for their participation, and for their permission to present this material.
REFERENCES
1. Maxwell, S., “Assessing the impact of microseismic location uncertainties on interpreted fracture geometries,” SPE paper 125121, SPE Annual Technical Conference, New Orleans, La., 2009.
2. Downie, R., “Improved evaluation of microseismic data through the use of cumulative frequency plots of microseismic event source parameters,” SPE paper 154968, SPE Unconventional Resources Conference, Pittsburgh, Pa., 2012.
3. Cipolla, C., et al, “A practical guide to interpreting microseismic measurements,” SPE paper 144067, SPE North American Unconventional Gas Conference, The Woodlands, Texas, 2011.
4. Maxwell, S., “What does microseismicity tell us about hydraulic fractures?” SEG Annual Meeting, San Antonito, Texas, and SPE paper 146932, SPE Annual Technical Conference, Denver, Colo., 2011.
5. Mayerhofer, M. J., et al, “What is Stimulated Reservoir Volume?,” SPE Production and Operations, February 2010.
6. Vermylen, P., et al, “Hydraulic fracturing microseismic magnitudes, and stress evolution in the Barnett shale, Texas, USA,” SPE paper 140507, SPE Hydraulic Fracturing Technology Conference, The Woodlands, Texas, 2011.
7. Cipolla, C., et al, “Integrating microseismic mapping and complex fracture modeling to characterize fracture complexity,” SPE paper 140185, SPE Hydraulic Fracturing Technology Conference, The Woodlands, Texas, 2011.
8. Weng, X., et al, “Modeling of hydraulic fracture network propagation in a naturally fractured formation,” SPE paper 140253, SPE Hydraulic Fracturing Technology Conference, The Woodlands, Texas, 2011.
|


