What’s new in well logging and formation evaluation
Part 2: Wireline Cased-Hole Logging, Coring, and Wellsite Evaluation—New developments include pulsed-neutron logging, casing integrity, flow profiling, intelligent tracers, nanoparticle contrast agents; wireline coring and pressure coring, core preservation, QC/QA of special-core analysis; cuttings-based correlation, mud-gas analysis, applications of advanced mud-gas analysis.
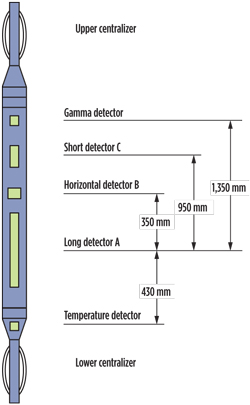
STEPHEN PRENSKY, Consultant, Silver Spring, MarylandWIRELINE LOGGING Several advances have been made in cased-hole wireline logging. These include new-generation pulsed-neutron logging tools, devices for assessing casing integrity, and a sensor package for flow profiling. Cased-hole/Pulsed-neutron logging. A recent operator-authored paper discusses the additional advantages and benefits to reservoir monitoring that accompany use of the new generation of three-detector pulsed-neutron logging (PNL) tools. These tools can provide valuable results, where data from conventional two-detector PNL tools may be ambiguous. The paper presents examples from a range of reservoir lithologies and produced fluids.38 TGT Oil & Gas Services introduced a new memory pulsed-neutron-neutron (PNN) tool. Conventional pulsed-neutron capture (sigma) logging (PNG) measures the secondary emission of gamma rays produced by neutron capture, whereas a PNN tool directly detects the neutron response. In PNN logging, the neutron-decay rate always goes down to zero, rather than to a baseline, i.e., natural gamma-ray background, which is subject to disturbance by scale deposits and can lead to noisy data. In general, a PNN tool can determine invasion in reservoirs with lower water salinities and porosities than can be logged by conventional PNG tools. The MINK tool saves all neutron-count decays to memory and processes from separately. A new processing method that is based on the maximum-likelihood method allows either increased accuracy of the water-saturation determination or faster logging speed. The tool specifications include an outside diameter of 43 mm, a 32-Mb memory that allows a 9-hr maximum recording time, and pressure and temperature ratings of 100 MPa and 150°C, respectively.39 Cased-hole/Casing integrity. Two through-tubing ultrasonic noise-logging devices (see World Oil, March 2008, p. 89) for locating casing leaks were recently introduced.40,41 One of these tools is able to detect leaks as small as 0.02 L/min.41 A new slimhole electromagnetic tool uses pulsed transient eddy currents to evaluate casing integrity (see World Oil, June 2010, p. 51). The 111/16-in. (42-mm) diameter GoWell EMDS (Electromagnetic Defectoscope) tool can simultaneously inspect tubing and the casing behind it, providing quantitative measurements of thickness in the tubing and first casing string behind it, and qualitative evaluation of thickness in a third string of casing. Pulsed (time-variant) power is supplied to the transmitter coil, which induces a transient electromagnetic flux in the surrounding tubing and or casing, in turn inducing secondary eddy currents in the cross-sections of the concentric tubular sections. These eddy current loops produce time-varying magnetic fields, which induce electromotive voltage in the tool’s receiver loop. The response of the receiver signal induced by the pulsed eddy currents from the transmitter is manifest in a convolution of the time-decay signal, with each increasing radius circular shell of metal corresponding to a “time window” in the decay. A change in tubular thickness results in a measureable change induced in the transient eddy current pattern that can be detected in the change of the time-domain decay spectrum. During the transmitter off-cycle, the measured signal decreases exponentially (i.e., decays), and the rate of decay is related to metal thickness around the transmitter and receiver—the greater the metal thickness, the slower the decay. The EMDS tool’s four detectors have different lengths and alignments, and each takes multiple amplitude measurements at different time intervals during each measurement cycle. The long vertical detector is sensitive to both the inner and outer strings of tubulars, and the short vertical detector is sensitive only to the inner string. One of the horizontal detectors is particularly sensitive to horizontal defects, only to the inner string, and the other horizontal detector provides the same measurements orthogonal to the first detector. The measurements are precise enough to detect small changes of thickness in the concentric tubulars. In addition to the four EM detectors, the tool also has a gamma-ray sonde for depth correlation and indications of scale, and a temperature sonde to detect holes and fluid influx, Fig. 1. The tool typically runs with a multi-finger caliper tool, which monitors the tubing inside-diameter. The tool is rated to 300°F (150°C) and 14,500 psi (100 MPa). The tool’s first string resolution is 0.15 mm and 0.5 mm, respectively, and for the second string it is 0.30 mm and 1.5 mm, respectively. Logging speed for thickness evaluation is 1,150 ft/hr (348 m/h), and for defect detection it is 500 ft/hr (150 m/h). Deliverables include the raw data curves and wall thickness (first and second string).42-44
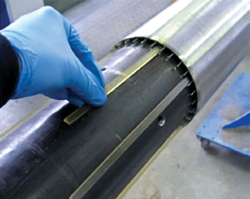
Cased-hole/Flow profiling. Conducting surveillance (i.e., flow-profiling) in extended-reach water-injection wells using conventional conveyance techniques can be difficult, especially in barefoot completions (a completion, where no casing or liner is set across the reservoir formation). A variety of factors, including friction with the borehole wall, soft formations and the presence of scale, can prevent production logging tools from reaching the necessary measured depths in these long boreholes. Maersk Oil has been developing a prototype of a self-contained, neutrally buoyant sensor that can reach the target depth by neutralizing the adverse effects of gravity and fiction. This technique uses a “disposable” device that remains in the borehole after completing the logging run. An acoustic-based wireless transmission system, that uses the injection water as the acoustic medium, is being investigated. To generate a water-injection flow profile, such a tool must determine its own velocity, the velocity of the water relative to the tool body, and the wellbore cross-sectional area. The Profile Scanner sensor package uses ultrasonic techniques to measure the wellbore cross-sectional area, and to determine the speed of the tool. The tool prototype has a 3.5-in. (90-mm) outside diameter, is 20.8 ft (6.3 m) long, and is constructed of carbon fiber. The OD is based on the 4.5-in diameter typical of Maersk’s injection completions. The prototype uses an inflatable nitrogen-filled bellows for active buoyancy maintenance. Propulsion is provided by an umbrella-shaped collapsible “sail,” fitted around the front end of the tool that allows it to “hover” in the injection water. The technology has been proven in a vertical test well, and field-testing in horizontal wells is ongoing.45 RESERVOIR MONITORING In this category, the use of chemical tracers to evaluate completion efficiency and design is discussed. Contrast agents are also helpful in mapping the position and movement of injected fluids. Permanent (intelligent) tracers. A recent advance in flow profiling is the development of nontoxic chemical tracers that can be placed with the completion to monitor flow from individual zones (stages) in horizontal completions. Hydrophobic or hydrophilic chemical tracers, each with a unique chemical identifier, can be integrated directly into completion components, e.g., screens, as tracer-impregnated polymer (matrix) strips,46, 47 (Fig. 2), or added to water-based completion fluids as unstable organic emulsions with each fracture stage.48 The tracer materials are designed to release their unique chemical compound (strips) or bind with the contact fluid, only when they come in contact with the target fluid— water, oil, or gas, for example—oil-soluble tracers do not release/bind when in contact with water, and vice versa, water-soluble tracers do not respond in contact with oil.
At the surface, specialized analytical equipment is used to simultaneously detect the extremely low levels (several parts per trillion) of several chemical tracers present in produced fluid samples. In addition to confirmation of oil flow from the individual stages, changes in the tracer concentration curve over time indicate how much oil from each stage was produced during that time, i.e., the technique provides a means for evaluating completion efficiency and completion design. Unlike radioactive tracers that may have a relatively short lifespan, chemical tracers can last for several years. Tracers are also used to measure fracture geometry and evaluate completions. To improve safety and reduce environmental and regulatory concerns, radioactive tracers are being replaced by tracer-impregnated proppant. High thermal-neutron-capture compounds that are included in the ceramic proppant during manufacture are placed in the fractures during the completion process, and then detected by conventional compensated- or pulsed-neutron logging tools. Interpretation of the logging data allows evaluation of fracture height and proppant location.49 Nanoparticle contrast agents. The ability to accurately map the position and movement of injected fluids, and/or the flood front downhole during hydraulic fracturing or reservoir flooding, is critical in effective, efficient reservoir management. However, current technologies, e.g., microseismic and time-lapse seismic, are relatively expensive.
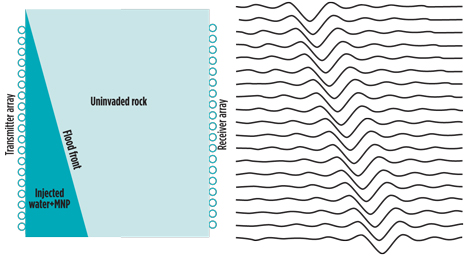
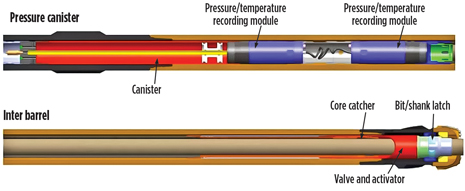
A more cost-effective method being investigated is the use of magnetic nanoparticle contrast agents that are placed with the injected fluids. The magnetic particles increase the fluid’s magnetic permeability and thus provide a unique, high-contrast signature that can be readily monitored (tracked) using repeated (time-lapse) electromagnetic measurements, e.g., cross-well tomography. The speed of the EM wave generated by a downhole pulsed transmitter decreases as it passes through the concentration of magnetic nanoparticles—this decrease is measured as an increased time delay in the received signal along the fluid front, Fig. 3. The magnetic properties can be “tuned” by controlling the size and composition of the particles.50,51 WIRELINE CORING Compared to conventional coring, wireline coring provides significant rig-time savings by recovering cores without tripping the whole drillstring, and it is well-suited for coring long sections and continuous coring. Cores are brought to surface faster, presumably with lower loss of formation gas and liquids. National Oilwell Varco has introduced a redesigned, wireline-retrievable coring system that is compatible with standard drill pipe. The use of standard, rather than specialty, drill pipe reduces the risk of sticking pipe, increases coring efficiency and reduces the cost of coring. Depending on formation type, a coring assembly up to 120 ft in long can be retrieved with wireline in a single run.52 Corpro’s new wireline-retrievable pressure coring system, QuickCapture
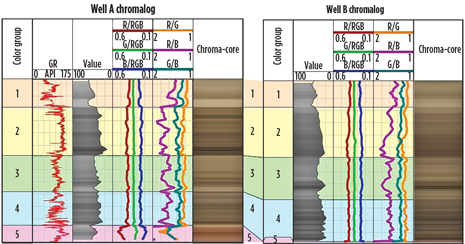
The volume of gas is measured as it is released from the tool and collected. Once the tool pressure is lowered to zero, or an acceptable pressure, the core is extruded and transferred to a transportation canister. The gas-storage canister temperatures and pressures are recorded, and total gas volumes are measured. The gas and fluids collected at surface, and in the gas-storage canisters, are transferred to the laboratory for further analysis. This system allows collection of 100% of all in-situ gases and liquids in a 10-ft 3 3-in. (3-m 3 7.6-cm) core. In addition to capturing all the expelled gas and liquids, pressure and temperature transducers, placed throughout the core barrel and collection canisters, monitor coring operations and record changes during the trip out of the hole. The tool is designed for borehole sizes ranging from 7.875 to 8.750 in. (200 to 222 mm), and is rated to 250° F (125° C) and 18,000 ft (5,500 m).53, 54 Core preservation. Preserving carbonate core in a “native state” during transportation, and for long-term storage, is difficult using conventional methods, such as epoxies, gypsum, or expanding foam, because these materials will fill the void space, e.g., vugs and fractures. Available techniques use encapsulation, submersion or envelopment. A recent paper describes a method for enveloping a section of core, contained in an inner core barrel or inner-core-barrel aluminum liner, in heat-sealed Mylar bags. The bags are layered composites of nylon, aluminum foil and polypropylene. To minimize core oxidation, a dry nonoxygenated gas, e.g., nitrogen, is used to replace the atmospheric air. The paper provides step-by-step instructions for applying this method.55 Quality control of special core-analysis (SCAL) data. As much as 70% of legacy SCAL data available to industry may not be “fit for purpose,” i.e., reliable. Reasons include inadequate design of the SCAL program and/or procedures or methods used in data acquisition; insufficient, or lack of, quality control of the resulting data (reducing data uncertainty); and poor reporting standards.56 Ensuring the accuracy and reliability of core-analysis data is an ongoing concern. Several recent papers have included recommendations, guidelines or proposed workflows to help improve the quality and long-term value of SCAL data.56-59 SURFACE DATA (MUD) LOGGING AND WELLSITE EVALUATION Chromastratigraphy for geologic characterization, along with an inexpensive method for analyzing gaseous systems are among the innovations in this category. Cuttings-based correlation. Chromastratigraphy uses rock-color (chromatic) data from drill cuttings, core or outcrop samples, to provide a rapid, reproducible, quantitative technique for geologic characterization, and correlation with other types of downhole data, e.g., wireline, geologic or geochemical. Raw color data are extracted from saturated slurries of pulverized samples and distilled water, using an imaging device and proprietary software, and used to calculate an average color for that depth or interval. Color data can be displayed in RGB color-component form or relative as changes through component ratios. When these data are plotted in well-log format, the curves show systematic, predictable changes that can be interpreted geologically and provide high-resolution, regional correlation, by themselves or combined with wireline data, Fig. 5. Studies have indicated that in some formations, color can serve as a proxy for total organic carbon (TOC), i.e., changes in a grey scale are related to changes in weight-percent TOC.60
Mud-gas analysis. Direct-sampling quadrupole mass spectrometry (DQMS) provides a fast, highly accurate (sensitivity of 0.1 ppm for C4+ species) and inexpensive method for analysis of gaseous systems. In contrast to conventional gas chromatography or gas chromatograph-mass spectrometry, gas is sampled without boiling-point separation, which allows rapid (< 90 sec) analysis of heavy-gas components, and inorganic gases and other species. In addition to detection of light-gas components (C1 to C5), which conventional wellsite chromatographs and mass spectrometers provide, DQMS also is capable of detecting heavy gas components (C6 to C10) and can distinguish among paraffins, napthenes and aromatics. This technique can also provide analysis of inorganic gases. While quadrupole mass spectrometry has been used in the field to perform field analysis of gases in borehole fluids,61 the recent introduction of miniature ruggedized systems, such as Fluid Inclusion Technology’s DQ1000,62 has made this technique readily available for real-time, wellsite mud-gas analysis.63,64 DQMS-derived hydrocarbon composition compares very well with laboratory-derived hydrocarbon composition and can serve as an indicator of thermal maturity and production type (liquid or dry gas) in vertical and horizontal wells.65,66 In unconventional plays, DQMS data have been used to identify lower-quality or residual systems, evaluate the potential for water production, assess compartmentalization, and to recognize fractures and faults—information used to optimize completions and production. Monitoring helium can serve as a proxy for porosity,67 while monitoring bit-generated hydrogen provides early indication of bit wear, failing downhole motors, and drillstring friction (Hall et al., 2013).
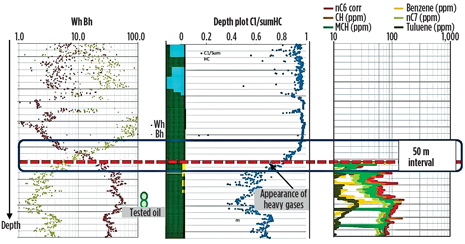
Advanced mud-gas (AMG) surface logging techniques provide continuous, real-time quantitative analysis of both light-end hydrocarbon-gas components, (C1 to C5), and either qualitative or quantitative analysis (depending on the mass spectrometer technology employed, see above) of heavy-gas and light aromatic components (C6 to C8 or C10) in mud gas. The ability to evaluate both the heavy- and light-gas components has increased the utility of mud-gas analysis (see World Oil, June 2010, p. 51, and July 2012, p. 107). AMG techniques provide rapid, cost-effective and safe real-time, or near-real-time, methods for formation evaluation. They assist in the evaluation of downhole fluids68 and fluid contacts in conditions where wireline or LWD methods (logs and fluid sampling) may be too expensive, where logging data may not be definitive due to production-related changes, e.g., highly depleted reservoirs69, and as a form of insurance logging where high-risk borehole conditions (e.g., high temperatures) prevent logging,70 Fig. 6. Detection of subtle trends in gas composition and gas-component ratios (e.g., wetness, character and balance), related to variations in formation lithology and fluid content, can be used to assist in real-time well placement (geosteering).71 GENERAL In the past year, there were two corporate mergers in the formation-evaluation arena. In 2012, Numerical Rocks (a spin-off from Statoil) merged with Digitalcore (a spin-off from the Australian National University) to form Lithicon, which will specialize in digital rock analysis. In April 2013, RPS Group acquired Knowledge Reservoir, forming an expanded consultancy capable of handling multidisciplinary projects in exploration and production. Industry think tank. The ITF (Industry Technology Facilitator) is a not-for-profit think tank established in 1999 to identify needed technology, foster innovation, and facilitate the development and implementation of new technologies. It is owned by 30 major operating and service companies, and has regional offices in Houston, Aberdeen, Abu Dhabi, Kuala Lumpur and Perth. The ITF has been responsible for initiating more than 190 collaborative and joint industry projects (JIPs) to address industry challenges that encompass the full range of E&P activities, including geology, geophysics, petrophysics, completions and production. The active projects include: 1) improved methods for measuring shale permeability; 2) petrophysics of tight sandstones; 3) a downhole imaging system; and 4) acoustic logging for evaluating well integrity.72 REFERENCES 38 Zett, A., et al., “Application of new generation multi-detector pulsed neutron technology in petrophysical surveillance,” paper YYY, presented at the SPWLA 53rd Annual Logging Symposium, Cartagena,
|

