MATT BLYTH, JEFF ALFORD and ED TOLLEFSEN, Schlumberger; and MAURO PELOROSSO, Eni Australia Ltd.
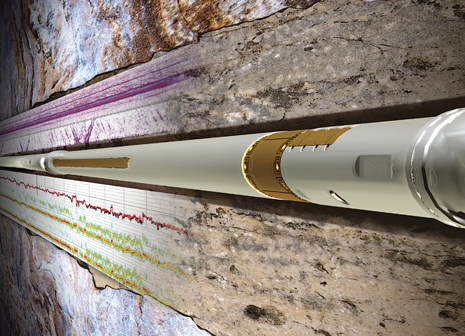 |
| Increasingly, real-time LWD acoustics measurements are being used to help obtain reliable pore pressure prediction and ensure wellbore stability management. |
|
The recent increase in drilling in challenging environments around the world has meant that the effective control and minimization of wellbore stability and pore-pressure related events, and their associated non-productive time (NPT), is critical to success. In addition, potential safety concerns associated with an unstable wellbore are well-known. Acoustics measurements are key, both to reliable pore-pressure prediction and to wellbore stability management.
Increasingly, real-time logging-while-drilling (LWD) acoustics measurements are being used for these applications. Real-time measurements are input into effective-stress models and are commonly used to map pressure trends and confirm modeled responses. Rigorous quality controls are essential to confirm the accuracy of these difficult, easily misinterpreted measurements. This real-time need has resulted in a rapid expansion of frequency, use and types of measurements available with LWD acoustic tools. Unfortunately, there had been little associated improvement in real-time data quality control capability.
Since the introduction of LWD acoustics technology, the limitation of data transmission rates imposed by mud pulse telemetry systems has meant that the processing of waveform data to acquire compressional slowness has had to be performed downhole, and with almost no ability to quality-control the results. For many years, real-time delivery was simply a calculated slowness curve and a simple measure of the associated similarity of the propagation across the receivers, known as coherence. Before running in hole, the engineer was required to make reasonably accurate estimates of what tool parameters to use, such as the expected formation compressional slowness range, transmitter firing frequency range, required stack size, waveform filtering and slowness time coherence (STC) processing. These had little, if any, means to change these selections, once the tool was below the rotary table.
This constraint on quality control caused problems with the general opinion and acceptance of early LWD compressional deliverables, particularly in cases in which critical drilling decisions had to be made, based on interpretations resulting from these data. Recently, new developments in real-time LWD sonic capability have dramatically increased the ability to quality-control (QC) the data provided, and have also enabled real-time capability to change tool parameters in the event of problematic data.
SINGLE CURVE PROBLEM
The downhole processing of most LWD sonic tools uses some variation of STC processing. The STC technique searches for wave components that have constant slowness across the tool receiver array and outputs this slowness (reciprocal of velocity) as the final answer. The slowness of the formation compressional wave is known as Delta T Compressional (DTCO), and the shear is known as Delta T Shear (DTSH). Delta T comes from the fact that slowness indicates the amount of time taken to travel a fixed distance and usually has units of µs/ft or µs/m.
Slowness time coherence processing is done at every waveform acquisition. As LWD tool downhole processing has no depth reference, the STC processing results are stored with a time reference instead. The data are referenced to depth, when the tool is brought back to surface, and the data are merged with a time-depth database maintained at surface during drilling. To deliver a real-time DTCO answer, the tool picks the most coherent answer within a predetermined time range and slowness range from the STC processing results. It is this answer, and the associated peak coherence, that is traditionally sent up-hole in real time.
The example shown in Fig. 1 illustrates the problems associated with being limited to a single curve as the real-time sonic answer. In this case, the figure shows a log example, where DTCO is varying wildly in a relative uniform formation. The coherence of the DTCO curve is relatively close to 100% throughout, but the curve response is obviously unrealistic. The question then becomes: Why? There is very limited information to make a decision, and there is no clear indication if part of the log is good, or if all of it is bad and should be discarded. It is also not clear what is the cause of the problem and if anything can be done while drilling to rectify it. In crucial real-time wellbore stability or petrophysical applications, these data would be untenable.
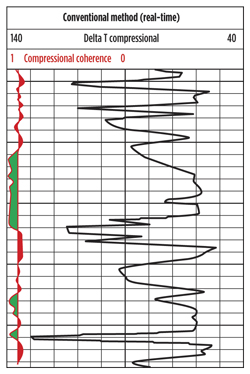 |
| Fig. 1. A log of DTCO obtained in real time, and on a 140-to-40 ms/ft horizontal scale and the associated coherence of DTCO (red) on a 1 to 0 scale. The vertical axis is depth. |
|
Previously, the only way to completely validate the response was to wait until the tool returned to surface and download the full waveform data from memory. Figure 2 shows the STC projection results from the memory processing, and here the cause of the problem can be clearly seen. The compressional label limits programmed into the tool were too wide, and as labeling algorithms favor the most coherent arrival within the minimum and maximum slowness limits, the monopole shear arrival was being selected, whenever it was more coherent than the compressional. Unfortunately, being able to obtain the continuously correct answer only from the memory data, likely after the section has been drilled, negates most of the benefit of running the sonic tools in real time. Obviously, therefore, it would be beneficial to be able to review the STC projection results in real time.
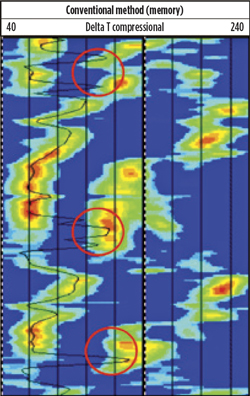 |
| Fig. 2. An STC projection log from the memory data, showing that the erratic DTCO (black) values observed in real time in Fig. 5 are due to the shear arrival being inside the chosen compressional labeling limits (white dashed lines). The log is presented on a 40 to 240 ms/ft horizontal scale. |
|
REAL-TIME STC PROJECTIONS
Due to the data rate limitation of mud pulse telemetry, it is not possible to telemeter full monopole waveform data in real time, and to perform full STC processing and log generation at surface while drilling. Instead, the results of downhole processing are sent uphole in an efficiently compact format and then reassembled into a log at surface.
Downhole STC processing is performed, and then the three or four most coherent peaks within the chosen search bandwidth are selected. The peak attributes of slowness, transit time and coherence are then transmitted uphole in a series of data packets, and the information is reassembled into a STC projection log in the surface software. To extract a numerical curve of slowness from this log, it is necessary to identify which peak represents the desired arrival and to produce a curve from that peak data. This is done by placing maximum and minimum slowness limits for each arrival on the log.
Figure 3 shows how the label limits and the outputted Delta-T (DT) curve appear on the log. The label limits are the two white dotted lines appearing either side of the compressional arrival. In this example, there are actually two labeled DT curves. One DTCO is produced downhole by the tool processing, using preprogrammed label limits, and the second Delta-T Compressional Uphole (DTCU) is produced on surface, using manually defined limits adjustable by the field engineer. This capability allows a key improvement in traditional real-time sonic services. With the projection in real time, it is possible to re-pick the compressional slowness uphole by adjustment of the minimum and maximum slowness limits in the event that the downhole picked data is not correct, or simply use it as a verification of what is being sent from downhole.
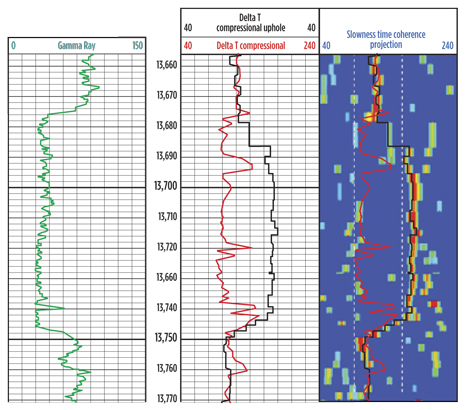 |
| Fig. 3. Real-time STC projection example. Track 1–Gamma Ray on a 0 to 150 GAPI scale. Track 2–DTCO (red) and DTCU (black) on a 40 to 240 ms/ft scale. Track 3–Real-time STC projection on a 40-240 scale, with the minimum and maximum compressional slowness limits (white dashed). |
|
Here, it can be seen that the slowness values generated in the shales above and below the sand package look reasonable enough, based on the real-time projection. However, the labeled DTCO through the sand, itself, is clearly mislabeled as the compressional arrival, as the sand is slower than expected and is sitting outside the label limits used. As discussed before, diagnosing this as the cause of the problem purely from the DTCO and coherence curves would be difficult, and if the DTCO value in the sand was taken as correct and used for any kind of evaluation, then it would quite clearly yield incorrect results. The solution in this case is to adjust the label limits used uphole and derive a correct DTCU curve over the zone in question. This relabeling is easily accomplished and can even be done retroactively over previously logged zones, anywhere in the well, should the original labeling be deemed to be incorrect with later, more-expert monitoring and review. Labeling issues, such as these, present a common source of error in real-time DT curves. Use of the real-time STC projection can clearly indicate when this is the case.
REAL-TIME TADPOLES AS QC TOOLS
An additional feature is available that can help distinguish real arrivals from noise and aliases on the STC planes in real time. Real-time tadpoles are a QC tool that can help distinguish which of the peaks sent in real time are real arrivals, and which may be noise or spatial aliasing effects, as a function of their arrival time. Figure 4 provides an explanation of the tadpoles and their interpretation.
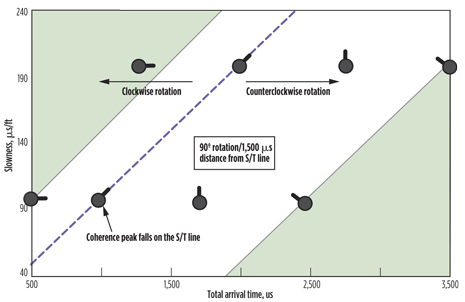 |
| Fig. 4. Explanation of the real-time tadpoles, showing that the orientation of the tadpole tail indicates the lateral displacement of the associated peak away from the STR line. |
|
The tadpole tail provides information about the lateral distance of the peak away from the slowness/time (S/T) line in the STC plane. The S/T line is the line that represents the correct relationship between the speed of the arrival, and the time it should take to travel the fixed distance between the transmitter and the receivers.
If the peaks fall directly on the S/T line, the tadpole will point 45° to the right (parallel to the S/T line). If the peak falls to the right of the S/T line, the tadpole rotates counterclockwise, proportional to distance from the S/T line. Conversely, if the peak falls to the left of the S/T line, the tadpole rotates clockwise. The tadpole tail therefore indicates the position of the associated peak relative to the S/T line. This can help QC the labeled DT value, as the associated tadpole should fall on or close to the S/T line, as indicated by the tadpole tail direction for the arrival to be considered real.
PUMPS OFF SLOWNESS AS A QC TOOL
One of the problems with attempting to obtain an acoustic log in a drilling environment is the high level of background noise produced by the drilling assembly, the bit and mud circulation. Acoustically, things are much more favorable when drilling is stopped, and the pumps are shut down to make a connection. Traditionally, the acoustic information from this period has only been available from the memory data, if at all. However, it is now possible to obtain these data in real time and use them as an ideal condition-reference QC for the real-time compressional answer.
Under normal situations, there should be close agreement between the drilling compressional velocities and the pumps-off ones. As the pumps-off measurement is made at a quieter time, it is usually the best indicator of the true formation compressional answer. In the event that drilling noise is affecting the real-time data, it can be seen by differences between the pumps-on and pumps-off answers. The pumps-off answer is still constrained by the same labeling limits used to produce the drilling answer, so it is not a solution to an incorrect labeling limit. In very high drilling noise situations, where drilling mechanics mitigation has failed or cannot be done for operational reasons, the pumps-off data may be the only possible source of reliable real-time compressional data. In this case, it is still a valid input for pore-pressure determination or other trend calculations, where a continuous curve is not available. It has recently become possible to send the three most coherent pumps-off data points in real time, which would allow the transmission of pumps-off shear information when available, in addition to compressional.
REAL-TIME SHEAR
An additional benefit of having a real-time STC projection showing the three (or more) most coherent arrivals at any depth, is that if monopole shear is present in the data, then it can be identified and labeled up-hole in real time. Figure 5 shows an example of shear present in the real-time data.
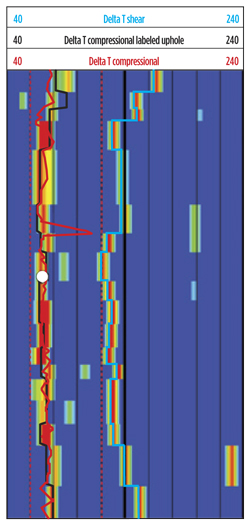 |
| Fig. 5. Real-time STC projection example, showing both a clear compressional arrival and a clear shear arrival. The white dot is the DTPO value from the pumps-off measurement, which is confirming the validity of the labeled compressional answer. The scale is 40-240 ms/ft. |
|
Being able to extract both a compressional and shear curve in real time provides the necessary inputs for updating a mechanical earth model in real time, thus being able to update both sides of the safe mud weight window while drilling. Such important drilling information that would be used to make critical pore-pressure prediction (PPP) decisions obviously needs to be very tightly quality-controlled, and this is where the real-time STC projection again proves to be an extremely valuable tool.
OPTIMIZING TOOL CONFIGURATIONS
A natural consequence of the improved QC offered by real-time STC and pumps-off peaks is a desire to modify operation of the tool, either in acquisition or processing, when it is noted that the tool is not performing optimally. So, another recent development in LWD technology, and one that has proved enormously useful, is the ability to communicate with the LWD tool while downhole, and to change acquisition and processing parameters, without the need to pull the tool back to surface. In the event that bad data are observed on the real-time STC projection, an informed decision can be made about what to do to improve the tools’ response. One particularly useful case has proven to be the ability to adjust firing and processing frequency ranges in the event of excessive drilling noise, or shock and vibration effects.
INCREASING CONFIDENCE
Logging-while-drilling acoustics measurements are not the only answer to maintaining safe well control practices, but they are a significant piece of the puzzle. When combined with other sources of information, they can help operators drill wells safer and faster, resulting in lower costs. However, there are numerous other benefits to acoustic data, as the measurements obtained are useful for a large range of additional applications. With such a broad swath of potential uses, it is critical that users of the data are confident in the quality obtained, regardless of when it is delivered. Quality control at the source is, therefore, key to maintaining the quality of the final output. This process begins with gaining a thorough understanding of what is happening to the measurements made while drilling and taking actions to rectify problems as soon as possible. 
This article is based on the SPWLA paper, “A new standard in real-time LWD sonic capability: Improving confidence in critical wellbore stability and formation evaluation decisions,” originally presented at the SPWLA 53rd Annual Logging Symposium, Cartagena, Colombia, June 16-20, 2012.
|
The author
MATTHEW BLYTH is a senior petrophysicist and has worked for Schlumberger since 1997, all in the LWD field. He is the LWD acoustics domain champion for the offshore North America market, supporting acoustics operations across all areas, from planning to acquisition and interpretation. He has worked in a variety of positions, including field operations, LWD sales, operations management and field engineer training, in locations in both the U.S. and Canada. Mr. Blyth obtained his masters degree in engineering in 1996 from Cambridge University in the UK. He is a member of SPWLA, SPE and SEG.
JEFF ALFORD is a senior petrophysicist working as the North America Land acoustic domain champion for PathFinder, a Schlumberger company, based in Houston. In addition to supporting operations at the field and client level, he is chiefly involved in developing geophysical and geomechanical solutions for drilling, formation evaluation and completion problems, with a focus on horizontal unconventional resources. Since joining Schlumberger in 1981, his experience in borehole acoustics includes field acquisition, as a log analyst specializing in seismic; sonic and ultra-sonic processing and interpretation, as a senior development engineer on the LWD acoustics projects; and as technical auditor for both wireline and LWD tools. Mr. Alford attended the University of Georgia for a BS degree in Geology, and Delgado University for an AS degree in electrical engineering. He is a member of SEG, HGS, SGS and SPWLA, serving on the local Houston SPWLA Chapter board for three years, and currently serving as the VP-IT for the national SPWLA organization.
ED TOLLEFSEN is the shale gas/oil business development manager for PathFinder, a Schlumberger company. Previously, he was the new technology business development manager for the Schlumberger Drilling & Measurements organization. He joined Schlumberger in 1990 and gained field experience in wireline evaluation, formation testing and sampling, and seismic services. During his time in wireline, he did much to increase pressure ratings on tools, improve borehole seismic capabilities and make Logging While Fishing a standard means of conveyance. After transitioning to the Drilling & Measurements segment, Mr. Tollefsen was reservoir and seismic domain champion for measurement and LWD operations in the Gulf of Mexico. During this time, he worked to improve LWD tool pressure ratings and extend the functionality of tools.
MAURO PELOROSSO works with the Eni Australia subsidiary. Previously he was with Eni U.S. Operating Co. He has worked for Eni as a petrophysicist since 2003. He spent two years in the Italian onshore and offshore market, following wellsite operations, and wireline and while-drilling data acquisition. From 2005 forward, he has worked in Algeria, the GOM and Australia as a petrophysicist in the Eni subsidiaries. He is mostly involved in the planning, acquisition and interpretation of wireline and while-drilling logs, and core data of onshore and offshore Eni wells, with exposure to clastics and carbonate reservoirs. He obtained his BS degree in geology in 2001 from G. d’Annunzio University in Italy. |
|


